Re: GIN improvements part2: fast scan - Mailing list pgsql-hackers
| From | Tomas Vondra |
|---|---|
| Subject | Re: GIN improvements part2: fast scan |
| Date | |
| Msg-id | 52E4AA3A.9000607@fuzzy.cz Whole thread Raw |
| In response to | Re: GIN improvements part2: fast scan (Heikki Linnakangas <hlinnakangas@vmware.com>) |
| Responses |
Re: GIN improvements part2: fast scan
Re: GIN improvements part2: fast scan |
| List | pgsql-hackers |
Hi!
On 25.1.2014 22:21, Heikki Linnakangas wrote:
> Attached is a new version of the patch set, with those bugs fixed.
I've done a bunch of tests with all the 4 patches applied, and it seems
to work now. I've done tests with various conditions (AND/OR, number of
words, number of conditions) and I so far I did not get any crashes,
infinite loops or anything like that.
I've also compared the results to 9.3 - by dumping the database and
running the same set of queries on both machines, and indeed I got 100%
match.
I also did some performance tests, and that's when I started to worry.
For example, I generated and ran 1000 queries that look like this:
SELECT id FROM messages
WHERE body_tsvector @@ to_tsquery('english','(header & 53 & 32 &
useful & dropped)')
ORDER BY ts_rank(body_tsvector, to_tsquery('english','(header & 53 &
32 & useful & dropped)')) DESC;
i.e. in this case the query always was 5 words connected by AND. This
query is a pretty common pattern for fulltext search - sort by a list of
words and give me the best ranked results.
On 9.3, the script was running for ~23 seconds, on patched HEAD it was
~40. It's perfectly reproducible, I've repeated the test several times
with exactly the same results. The test is CPU bound, there's no I/O
activity at all. I got the same results with more queries (~100k).
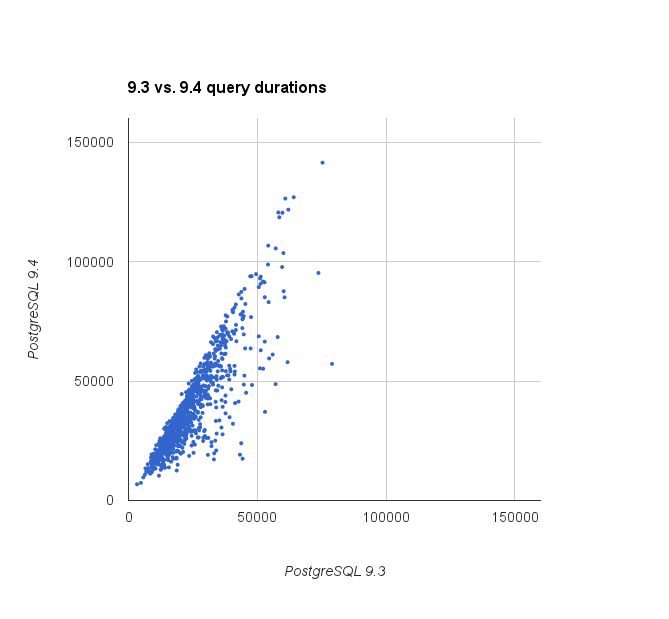
Attached is a simple chart with x-axis used for durations measured on
9.3.2, y-axis used for durations measured on patched HEAD. It's obvious
a vast majority of queries is up to 2x slower - that's pretty obvious
from the chart.
Only about 50 queries are faster on HEAD, and >700 queries are more than
50% slower on HEAD (i.e. if the query took 100ms on 9.3, it takes >150ms
on HEAD).
Typically, the EXPLAIN ANALYZE looks something like this (on 9.3):
http://explain.depesz.com/s/5tv
and on HEAD (same query):
http://explain.depesz.com/s/1lI
Clearly the main difference is in the "Bitmap Index Scan" which takes
60ms on 9.3 and 120ms on HEAD.
On 9.3 the "perf top" looks like this:
34.79% postgres [.] gingetbitmap
28.96% postgres [.] ginCompareItemPointers
9.36% postgres [.] TS_execute
5.36% postgres [.] check_stack_depth
3.57% postgres [.] FunctionCall8Coll
while on 9.4 it looks like this:
28.20% postgres [.] gingetbitmap
21.17% postgres [.] TS_execute
8.08% postgres [.] check_stack_depth
7.11% postgres [.] FunctionCall8Coll
4.34% postgres [.] shimTriConsistentFn
Not sure how to interpret that, though. For example where did the
ginCompareItemPointers go? I suspect it's thanks to inlining, and that
it might be related to the performance decrease. Or maybe not.
I've repeated the test several times, checked all I could think of, but
I've found nothing so far. The flags were exactly the same in both cases
(just --enable-debug and nothing else).
regards
Tomas
Attachment
pgsql-hackers by date: