Re: Proposal Dashboard design for system of pgadmin - Mailing list pgadmin-hackers
| From | Kunal Garg |
|---|---|
| Subject | Re: Proposal Dashboard design for system of pgadmin |
| Date | |
| Msg-id | CAGhWKD9k1e10HKUi8z4huATRHnM_2uJANXNYoT=Wh0=u+qhL+w@mail.gmail.com Whole thread |
| In response to | Re: Proposal Dashboard design for system of pgadmin (Dave Page <dpage@pgadmin.org>) |
| Responses |
Re: Proposal Dashboard design for system of pgadmin
|
| List | pgadmin-hackers |
This is the updated proposal answering the questions and queries given in feedback, I have provided varying options for the UI/UX. we can set up a short call to finalize one of the approaches.
Please find it below.
thanks kunal garg

GUI representation of monitoring System Activity
with the system_stats Extension in pgAdmin 4
Proposal for Layout of Pgadmin4 Dashboard
Plan:-
To integrate a detailed view of system activity into the existing pgAdmin dashboard following a consistent design that matches the existing UI/UX and meets User Acceptance Testing Standards.
Proposed Layout Design:-
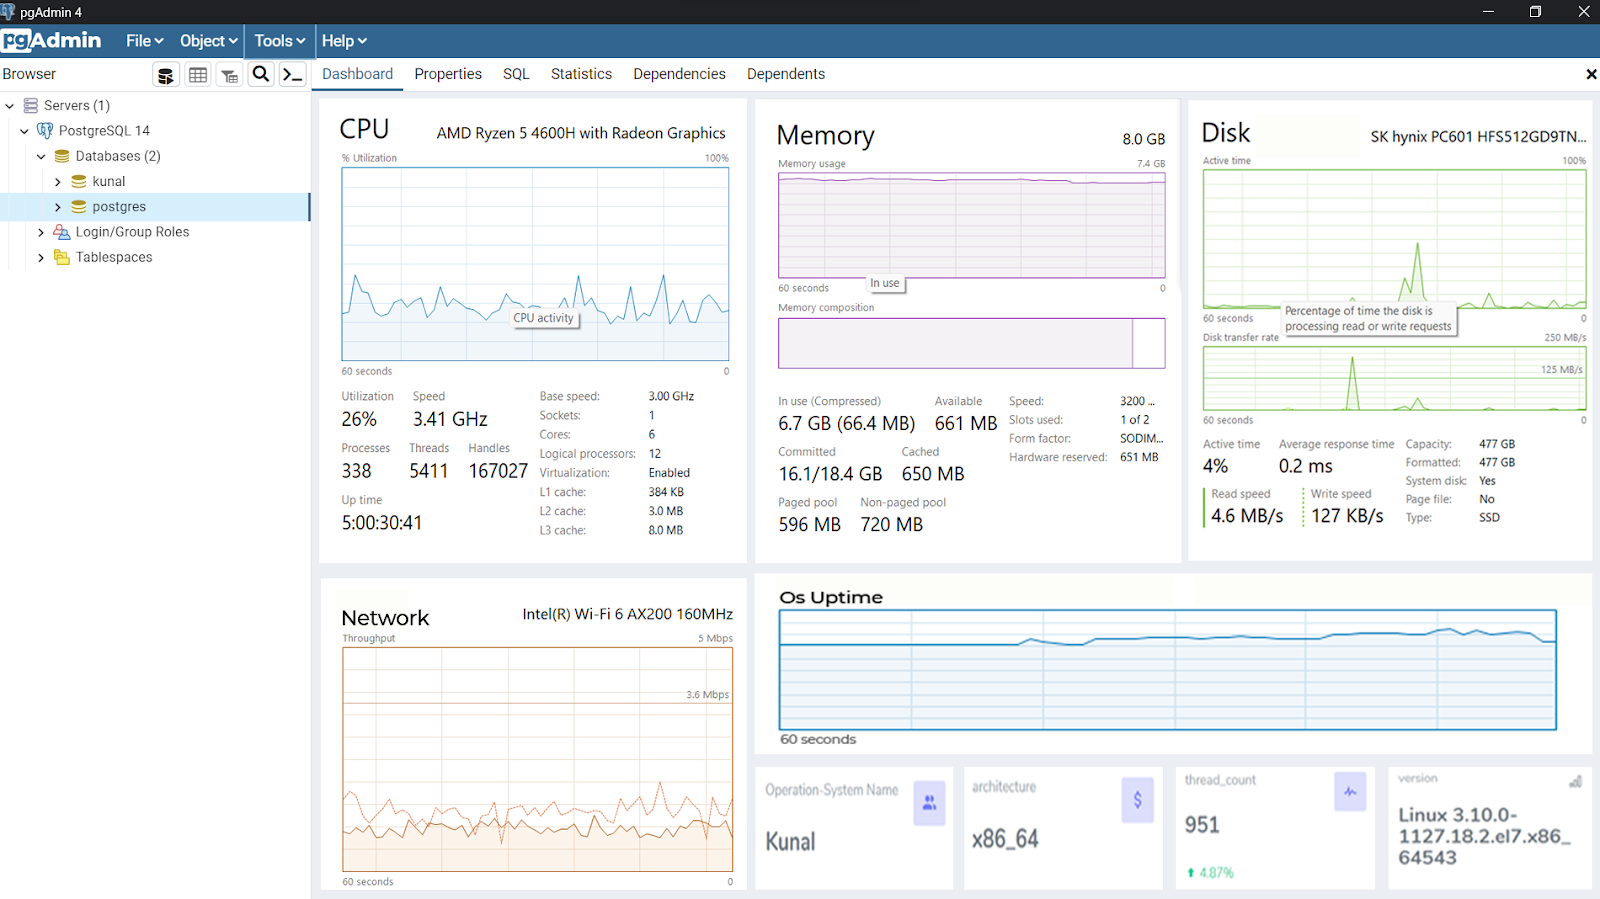
Data fetched from queries:-
Details of different queries will be shown on a given component/card as shown in the design.
CPU
S.No. | Component | Type | Representation | Unit |
1 | Model Name | Static | Text | - |
2 | Logical Processors | Dynamic | Text | - |
3 | Base Speed | Dynamic | Text | GHz |
4 | L1, L2, L3 cache size | Dynamic | Text | KB/MB |
5 | Kernel mode percentage Idle mode percentage User normal process percentage | Dynamic | CPU activity Graph | % |
Memory
S.No. | Component | Type | Representation | Unit |
1 | Total Memory Used Memory Free Memory | Static Dynamic | Pie chart | GB |
2 | Cache total Cache Used Cache Free | Dynamic | Memory Composition Graph (Pie chart/Line graph) | MB |
3 | Total Process Running Process Zombie Process | Dynamic | Text/Graph | - |
Disk
S.No. | Component | Type | Representation | Unit |
1 | Total Space | Static | Text | |
2 | Used Space | Dynamic | Text | |
3 | Read Speed | Dynamic | Text | |
4 | Write Speed | Dynamic | Text | |
5 | Disk Name | Static | Text | |
6 | Avg Load per min | Dynamic | Line Graph |
OS
S.No. | Component | Type | Representation | Unit |
1 | Name | Static | Text | - |
2 | Architecture | Dynamic | Text | - |
3 | Thread Count | - | Text | - |
4 | Handle count | - | Text | - |
5 | Process Count | - | Text | - |
6 | OS up time | Dynamic | Text+Graph | seconds |
Network
S.No. | Component | Type | Representation | Unit |
1 | Name | Static | Text | |
2 | Transmitted bytes Transmitted Package | Dynamic | Line Graphs (combined) | |
3 | Received bytes Received Package | Dynamic |
Impact on the existing layout:-
Existing layout will remain the same for most of the part. Here are some options for showing the system stats dashboard option to the users.
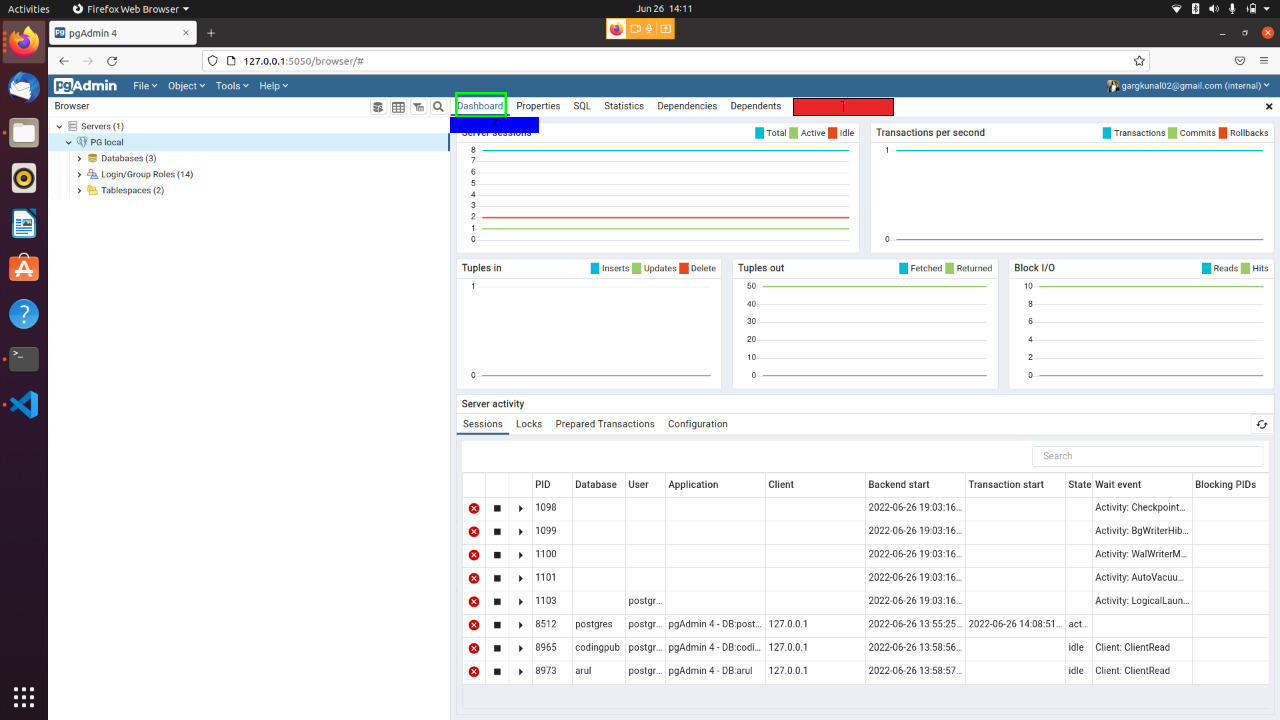
New button for system statistics on the Dashboard Navbar (refer to the red box in the image for the location of this button)
UI impact when the system_stats extension is not present in the PostgreSQL instance:
The page will open as usual with the following message,
“No system statistics information is available for the selected object”
On hovering over the Dashboard tab, a dropdown will come, giving the user an option to select either the already existing pgadmin dashboard or the system statistics dashboard. (refer to the green box in the image for the location of this button)
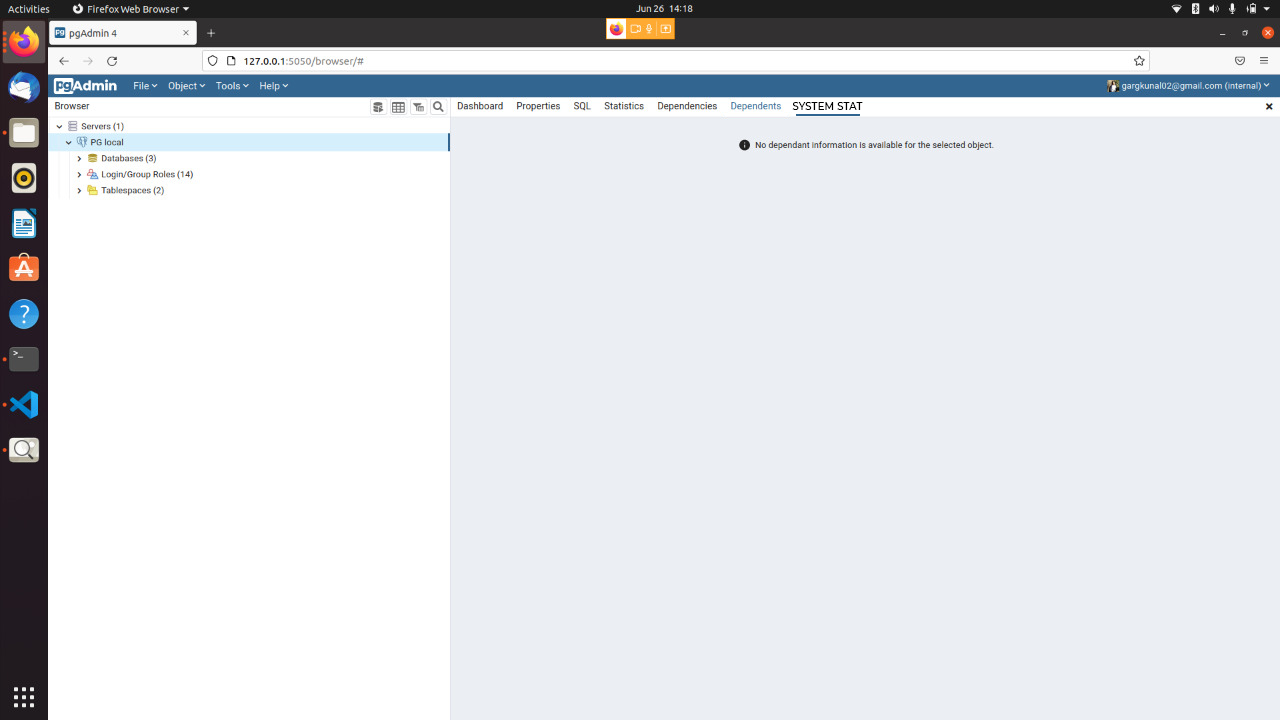
UI impact when the system_stats extension is not present in the PostgreSQL instance:
This will happen only when the user has not selected any server, then the dashboard will open as usual as shown in the image.
On Selecting the Dashboard tab, 2 new buttons will be displayed under the dashboard tab, clicking any one will show the respective dashboard. (refer to the blue box in the image for the location of this button)
UI impact when the system_stats extension is not present in the PostgreSQL instance:
This will happen only when the user has not selected any server, then the dashboard will open as usual as shown in the image
Note: The dashboards are contextual, they're dependent on the node selected on the left-hand side tree, that is, the values change as per the server node selected. Similarly, the system statistics dashboard will also be contextual and change with the selected server.
Filters available in the preferences:-
Under the files tab -> Preferences
In preferences there are multiple dropdowns for different parts of the dashboard, giving the user power to customize the dashboard as per their need by enabling or disabling certain graphs and changing the refresh rate of the graphs.
In the preferences tab, there is a drop-down by the name of “dashboard”, which gives 2 options for selecting “graphs” and “display”. A similar layout will be followed for the “system statistics” dashboard.
Graphs:
- Here, the user can select the refresh rate or the time interval of the graphs as per their need. The default value will be set to 1 second, but the users can vary it to any value they prefer.
Display:
- Enabling or disabling this dashboard / enabling or disabling the individual charts within the dashboard
As per the preferences selected, the system statistics dashboard will be dynamically updated.
i.e.
CPU
Memory
Disk
Network
Os time
Os name
Architecture
Version
Show graph data points?
Show graphs?
HiOn Thu, 23 Jun 2022 at 07:27, Kunal Garg <gargkunal02@gmail.com> wrote:Thankyou for the feedback, I will incorporate the changes accordingly and email the revised version.Please also send it as a plain email, not a PDF. That makes it much easier to reply and comment inline.Thanks!On Thu, 23 Jun, 2022, 10:49 am Ashesh Vashi, <ashesh.vashi@enterprisedb.com> wrote:Hi Kunal,The proposal must include:- Impact on the existing layout (Where would the existing contents of the dashboard go?).- UI impact when the system_stats extension is not present in the PostgreSQL instance.- Introduction of the preferences for enabling/disabling this dashboard and/or the individual charts within this dashboard.
- Introduction of the preferences to change the time interval between probing the database server itself for these chart metrics.NOTE:
* Please study the existing charts of the existing dashboards.
* Dashboards are contextual, they're dependent on the node selection of the 'Browser' tree on the left hand side.On Thu, Jun 23, 2022 at 4:02 AM Kunal Garg <gargkunal02@gmail.com> wrote:Hi,Proposing the dashboard design of pgadmin for the system stats.Attached is a proposal for incorporating the os details to the pgadmin dashboard.--
pgadmin-hackers by date: