Thanks Fabio for your help.
From: Fabio Pardi <f.pardi@portavita.eu>
Sent: dinsdag 28 juli 2020 11:46
To: Bhattacharjee, Soumik <soumik.bhattacharjee@kpn.com>; pgsql-admin@lists.postgresql.org
Subject: Re: Cache Hit Ratio%
Depending on your PostgreSQL RAM budget, you might want to increase the shared_buffers in order to be able to fit more in it.
If I were you, I would investigate the matter more in depth, and educate yourself on the subject.
You can get insights using pg_buffercache:
https://www.postgresql.org/docs/current/pgbuffercache.html
When in need, I also use the following query to understand how the buffers are rotating.
select usagecount,count(*),isdirty
from pg_buffercache
group by isdirty,usagecount
order by isdirty,usagecount ;
hope it helps.
regards,
fabio pardi
Hi,
This are the values for
- effective_cache_size = 6GB
- OS RAM = 25GB
Thanks..
Hi Fabio,
Its same across all env's
- Shared_buffers is 2GB
- DB size is same 12GB
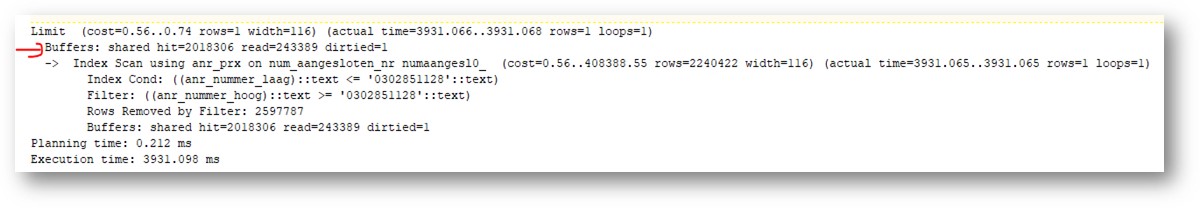
Query Plan in PROD Env
Hi,
I would start checking (and comparing with pre-prod) the db size, the shared_buffers size, how much data end up in cache and how are the cache layer's used.
regards,
fabio pardi
Dear Experts,
We have done production migration from Oracle to PostgreSQL.
Could you please help me to know where to look out for - the Cache Hit Ratio is always at 65.72% , but in lower Pre-Prod env it’s kind of 95%.
As such no major slowness is reported by the customer so far.
Thanks