Re: [PoC] Non-volatile WAL buffer - Mailing list pgsql-hackers
| From | Tomas Vondra |
|---|---|
| Subject | Re: [PoC] Non-volatile WAL buffer |
| Date | |
| Msg-id | 381da20e-7c3d-ab14-ac94-9a905e59d1e4@enterprisedb.com Whole thread Raw |
| In response to | Re: [PoC] Non-volatile WAL buffer (Tomas Vondra <tomas.vondra@enterprisedb.com>) |
| Responses |
Re: [PoC] Non-volatile WAL buffer
|
| List | pgsql-hackers |
Hi,
Here's the "simple patch" that I'm currently experimenting with. It
essentially replaces open/close/write/fsync with pmem calls
(map/unmap/memcpy/persist variants), and it's by no means committable.
But it works well enough for experiments / measurements, etc.
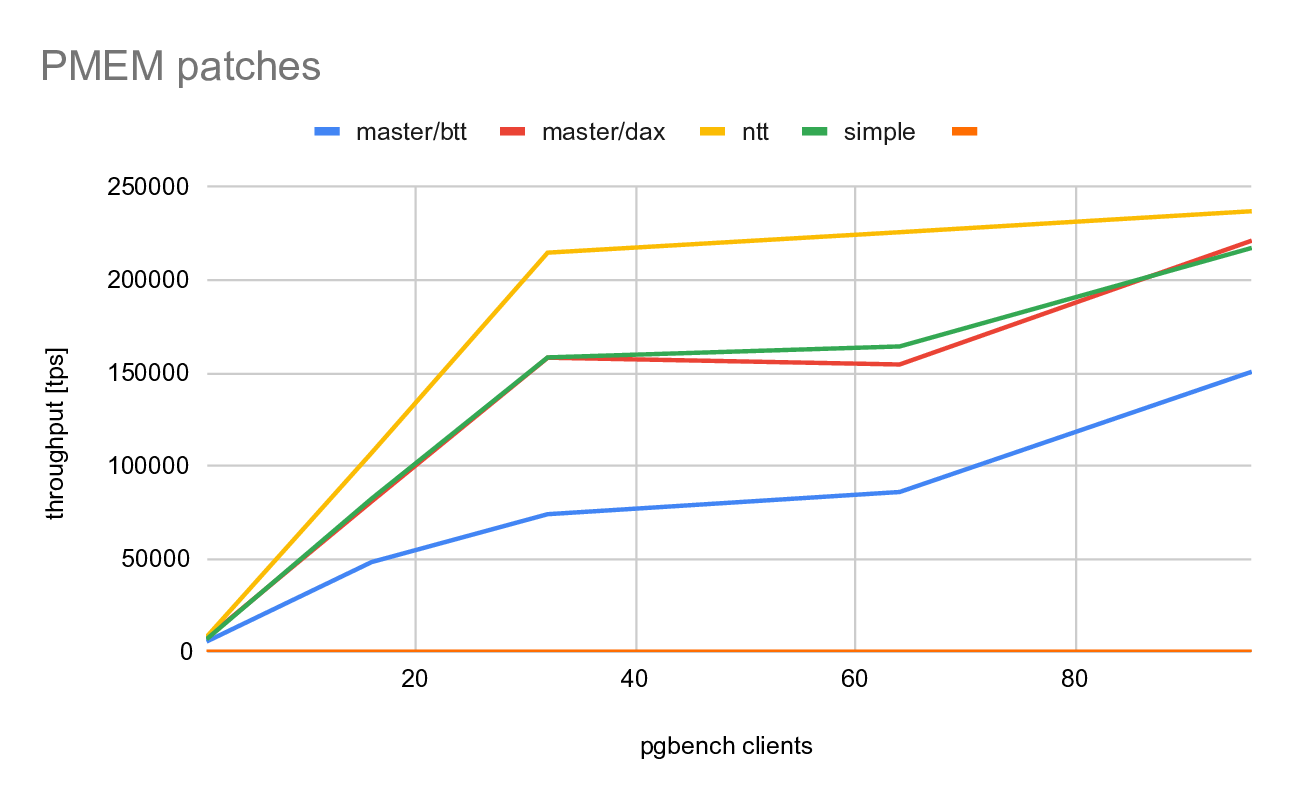
The numbers (5-minute pgbench runs on scale 500) look like this:
master/btt master/dax ntt simple
-----------------------------------------------------------
1 5469 7402 7977 6746
16 48222 80869 107025 82343
32 73974 158189 214718 158348
64 85921 154540 225715 164248
96 150602 221159 237008 217253
A chart illustrating these results is attached. The four columns are
showing unpatched master with WAL on a pmem device, in BTT or DAX modes,
"ntt" is the patch submitted to this thread, and "simple" is the patch
I've hacked together.
As expected, the BTT case performs poorly (compared to the rest).
The "master/dax" and "simple" perform about the same. There are some
differences, but those may be attributed to noise. The NTT patch does
outperform these cases by ~20-40% in some cases.
The question is why. I recall suggestions this is due to page faults
when writing data into the WAL, but I did experiment with various
settings that I think should prevent that (e.g. disabling WAL reuse
and/or disabling zeroing the segments) but that made no measurable
difference.
So I've added some primitive instrumentation to the code, counting the
calls and measuring duration for each of the PMEM operations, and
printing the stats regularly into log (after ~1M ops).
Typical results from a run with a single client look like this (slightly
formatted/wrapped for e-mail):
PMEM STATS
COUNT total 1000000 map 30 unmap 20
memcpy 510210 persist 489740
TIME total 0 map 931080 unmap 188750
memcpy 4938866752 persist 187846686
LENGTH memcpy 4337647616 persist 329824672
This shows that a majority of the 1M calls is memcpy/persist, the rest
is mostly negligible - both in terms of number of calls and duration.
The time values are in nanoseconds, BTW.
So for example we did 30 map_file calls, taking ~0.9ms in total, and the
unmap calls took even less time. So the direct impact of map/unmap calls
is rather negligible, I think.
The dominant part is clearly the memcpy (~5s) and persist (~2s). It's
not much per call, but it's overall it costs much more than the map and
unmap calls.
Finally, let's look at the LENGTH, which is a sum of the ranges either
copied to PMEM (memcpy) or fsynced (persist). Those are in bytes, and
the memcpy value is way higher than the persist one. In this particular
case, it's something like 4.3MB vs. 300kB, so an order of magnitude.
It's entirely possible this is a bug/measurement error in the patch. I'm
not all that familiar with the XLOG stuff, so maybe I did some silly
mistake somewhere.
But I think it might be also explained by the fact that XLogWrite()
always writes the WAL in a multiple of 8kB pages. Which is perfectly
reasonable for regular block-oriented storage, but pmem/dax is exactly
about not having to do that - PMEM is byte-addressable. And with pgbech,
the individual WAL records are tiny, so having to instead write/flush
the whole 8kB page (or more of them) repeatedly, as we append the WAL
records, seems a bit wasteful. So I wonder if this is why the trivial
patch does not show any benefits.
regards
--
Tomas Vondra
EnterpriseDB: http://www.enterprisedb.com
The Enterprise PostgreSQL Company
Attachment
pgsql-hackers by date: