Re: 9.5: Memory-bounded HashAgg - Mailing list pgsql-hackers
| From | Tomas Vondra |
|---|---|
| Subject | Re: 9.5: Memory-bounded HashAgg |
| Date | |
| Msg-id | 5407995C.7070601@fuzzy.cz Whole thread |
| In response to | Re: 9.5: Memory-bounded HashAgg (Tomas Vondra <tv@fuzzy.cz>) |
| Responses |
Re: 9.5: Memory-bounded HashAgg
|
| List | pgsql-hackers |
On 29.8.2014 00:02, Tomas Vondra wrote:
> On 26.8.2014 21:38, Jeff Davis wrote:
>> On Tue, 2014-08-26 at 12:39 +0300, Heikki Linnakangas wrote:
>>> I think this is enough for this commitfest - we have consensus on
>>> the design. For the next one, please address those open items, and
>>> resubmit.
>>
>> Agreed, return with feedback.
>>
>> I need to get the accounting patch in first, which needs to address
>> some performance issues, but there's a chance of wrapping those up
>> quickly.
>
> Sounds good to me.
>
> I'd like to coordinate our efforts on this a bit, if you're interested.
>
> I've been working on the hashjoin-like batching approach PoC (because I
> proposed it, so it's fair I do the work), and I came to the conclusion
> that it's pretty much impossible to implement on top of dynahash. I
> ended up replacing it with a hashtable (similar to the one in the
> hashjoin patch, unsurprisingly), which supports the batching approach
> well, and is more memory efficient and actually faster (I see ~25%
> speedup in most cases, although YMMV).
>
> I plan to address this in 4 patches:
>
> (1) replacement of dynahash by the custom hash table (done)
>
> (2) memory accounting (not sure what's your plan, I've used the
> approach I proposed on 23/8 for now, with a few bugfixes/cleanups)
>
> (3) applying your HashWork patch on top of this (I have this mostly
> completed, but need to do more testing over the weekend)
>
> (4) extending this with the batching I proposed, initially only for
> aggregates with states that we can serialize/deserialize easily
> (e.g. types passed by value) - I'd like to hack on this next week
>
> So at this point I have (1) and (2) pretty much ready, (3) is almost
> complete and I plan to start hacking on (4). Also, this does not address
> the open items listed in your message.
Hi,
Attached are patches implementing this. In the end, I decided to keep
the two approaches separate for now, i.e. either the HashWork-based
batching, or hashjoin-like batching. It's easier to play with when it's
separate, and I think we need to figure out how the two approaches fit
together first (if they fit at all).
Shared patches:
(1) hashagg-dense-allocation-v1.patch
- replacement for dynahash, with dense allocation (essentially the
same idea as in the hashjoin patch)
- this is necessary by the hashjoin-like batching, because dynahash
does not free memory
- it also makes the hashagg less memory expensive and faster (see
the test results further down)
- IMHO this part is in pretty good shape, i.e. I don't expect bugs
or issues in this (although I do expect pushback to replacing
dynahash, which is a code widely used in the whole codebase).
(2) memory-accounting-v1.patch
- based on the ideas discussed in the 'memory accounting thread',
with some improvements
- this really needs a lot of work, the current code works but there
are various subtle issues - essentially this should be replaced
with whatever comes from the memory accounting thread
These two patches need to be applied first, before using either (3a-b)
or (4), implementing the two batching approaches:
(3a) hashagg-batching-jeff-v1.patch
- essentially a 1:1 of Jeff's patch, applied on top of the dense-
allocated hash table, mentioned in (1)
- I also ran into a few bugs causing segfaults IIRC (I'll report
them in a separate message, if I remember them)
(3b) hashagg-batching-jeff-pt2-v1.patch
- this adds two things - basic estimation of how many partitions
to use, and basic info to explain
- the idea behind estimating number of partitions is quite simple:
We don't really need to decide until the first tuple needs to be
stored - when that happens, see how many more tuples we expect,
and use this ratio as the number of partitions (or rather the
nearest power of 2). In most cases this number of partitions
is higher, because it assumes once we get the same number of
tuples, we'll get the same number of new groups. But that's most
likely untrue, as some of the groups are already present in the
hash table.
This may be further improved - first, at this stage we only know
the expected number of input tuples. Second, with various
aggregates the existing states may grow as more tuples are added
to the state.
So at the end we can look at how many tuples we actually got,
and how much memory we actually consumed, and use that to decide
on the size for the second-level HashWork items. For example, if
we expected N tuples, but actually got 2*N, and at the end of
the initial batch we ended up with 2*work_mem, we may choose
to do 4 partitions in the second step - that way we're more
likely not to exceed work_mem, and we can do that right away.
I believe this might effectively limit the necessary HashWork
levels to 2:
* initial scan
* 1st level : # of partitions determined on the first tuple
* 2nd level : # of partitions determined at the end of the
initial scan
Does that make sense?
- regarding the info added to explain, I came to conclusion that
these values are interesting:
* number of batches - how many HashWork items were created
* number of rebatches - number of times a HashWork is split into
partitions
* rescan ratio - number of tuples that had to be stored into a
batch, and then read again
- this may be higher > 100% if there are multiple
levels of HashWork items, so a single tuple may
be read/stored repeatedly because of using too
low number of partitions
* min/max partitions size (probably not as useful as I thought)
And the hashjoin-like batching (which is in considerably less mature
state compared to the previous patch):
(4) hashagg-batching-hashjoin-v1.patch
- there's not much to say about the principle, it's pretty much the
same as in hashjoin, and uses a single level of batches (as
opposed to the tree-ish structure of HashWork items)
- I added similar info to explain (especially the rescan ratio)
- currently this only supports aggregates with states passed by
value (e.g. COUNT(*))
- extension to known types seems straightforward, supporting
'internal' will require more work
So either you apply (1), (2), (3a) and (3b), or (1), (2) and (4).
All the patches currently pass 'make installcheck', expect for a few
failures that are caused by different order of rows in the result (which
is really an issue in the test itself, not using an ORDER BY clause and
expecting sorted output).
Regarding memory contexts
-------------------------
Both patches measure only memory used for the hash table, not the whole
aggcontext, which is really the right thing to measure. For aggregates
using passed-by-value states this does not make any differece, but
passed-by-ref states are allocated in aggcontext.
For example array_agg creates sub-contexts of aggcontext for each group.
So I think the hierarchy of context will require some rethinking,
because we want/need to throw away the states between partitions. As
this is currently located in aggcontext, it's difficult (we'd have to
redo the whole initialization).
Work_mem sizes
--------------
Another problem with the current memory accounting is that it tracks
blocks, not individual palloc/pfree calls. However AllocSet keeps some
of the blocks allocated for future use, which confuses the accounting.
This only happens with small work_mem values, values like 8MB or more
seem to work fine. I'm not sure what the accounting will look like, but
I expect it to solve this issue.
Testing and benchmarking
------------------------
I also did some basic testing, with three datasets - the testing scripts
and results are attached in the hashagg-testing.tgz. See the
hashagg-bench.sql for details - it creates three tables: small (1M),
medium (10M) and large (50M) with columns with different cardinalities.
The a series of GROUP BY queries is executed - query "a" has 1:1 groups
(i.e. 1 group per table rows), "b" 1:10 (10 rows per group), "c" 1:100
and "d" only 100 groups in total. These queries are executed with
different work_mem values (64MB to 1GB), and the durations are measured.
See the hashagg-bench.sql script (in the .tgz) for details.
Attached are two CSV files contain both raw results (4 runs per query),
and aggregated results (average of the runs), logs with complete logs
and explain (analyze) plans of the queries for inspection.
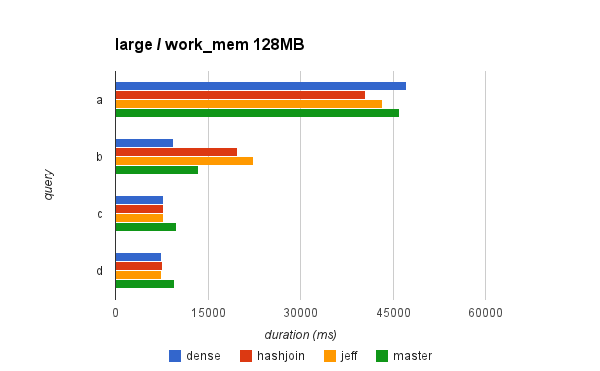
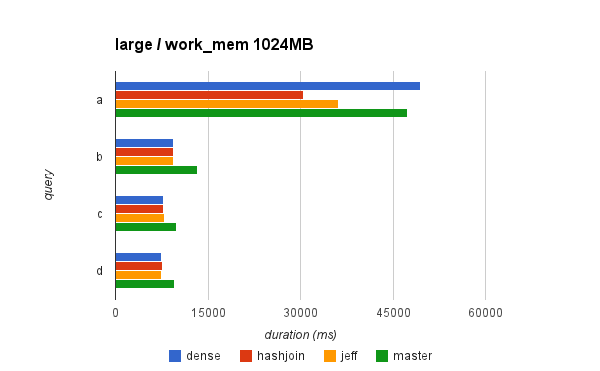
Attached are two charts for the large dataset (50M), because it nicely
illustrates the differences - for work_mem=1024MB and work_mem=128MB.
In general, it shows that for this set of queries:
* Dense allocation gives ~20% speedup (and this is true for the
other datasets). The only case when this is not true is query "a"
but that's the query not using HashAggregate (so the dense
allocation has nothing to do with this, AFAIK).
* The difference between the two approaches is rather small.
Sometimes the Jeff's approach is faster, sometimes hashjoin-like
batching is faster.
* There may be cases when we actually slow-down queries, because we
trigger batching (irrespectedly of the approach). This is a
feature, not a bug. Either we want to respect work_mem or not.
It's important to say however that this test is extremely simplistic and
very simple for the planner to get the number of groups reasonably
right, as the queries are grouping by a single column with a quite well
known cardinality. In practice, that's hardly the case. And incorrect
estimates are probably the place where the differences between the
approaches will be most significant.
Also, the 'large' dataset is not really as large as it should be. 50M
rows is not that much I guess.
I think we should create a wider set of tests, which should give us some
insight into proper costing etc.
Tomas
Attachment
pgsql-hackers by date: