Re: what to revert - Mailing list pgsql-hackers
| From | Tomas Vondra |
|---|---|
| Subject | Re: what to revert |
| Date | |
| Msg-id | abc7b880-ebd3-39a8-0a25-51dbd7d67f18@2ndquadrant.com Whole thread Raw |
| In response to | Re: what to revert (Kevin Grittner <kgrittn@gmail.com>) |
| Responses |
Re: what to revert
Re: what to revert |
| List | pgsql-hackers |
Hi,
I've repeated the tests with the read-only workload, with the number of
runs for each combination increased to 20 (so 4x higher compared to the
initial runs). Also, this time I've collected sar statistics so that
there's a chance of investigating the sudden tps drops observed in some
of the cases. All the tests were on 8ee29a19, i.e. the commit that
stamped 9.6beta1.
Attached is an ODS spreadsheet with the basic data, the full logs are
available in the same google drive folder as before (old_snapshot2.tgz):
https://drive.google.com/open?id=0BzigUP2Fn0XbR1dyOFA3dUxRaUU
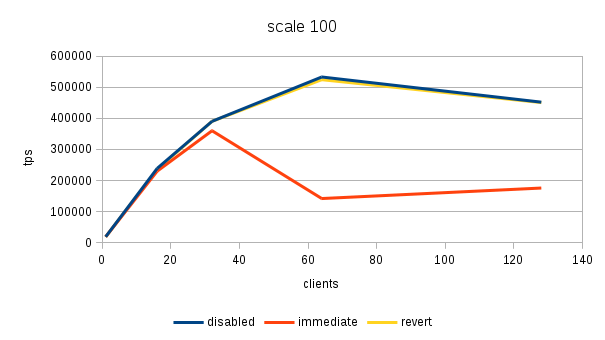
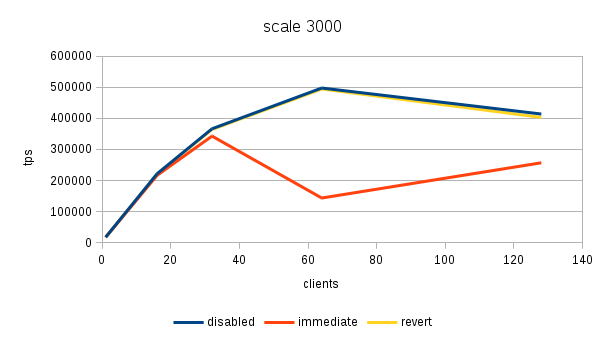
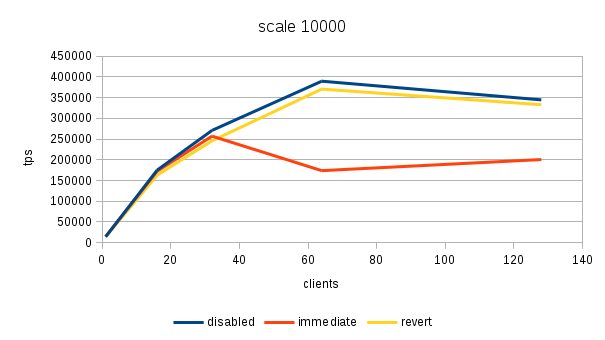
The results (average tps) for the three scales (100, 3000 and 100000)
look like this (also see the three charts attached):
scale dataset 1 16 32 64 128
-------------------------------------------------------------------
100 disabled 18810 238813 390341 532965 452003
100 immediate 18792 229819 360048 141869 175624
100 revert 18458 235814 390306 524320 450595
scale dataset 1 16 32 64 128
-------------------------------------------------------------------
3000 disabled 17266 221723 366303 497338 413649
3000 immediate 17277 216554 342688 143374 256825
3000 revert 16893 220532 363965 494249 402798
scale dataset 1 16 32 64 128
-------------------------------------------------------------------
10000 disabled 14383 174992 270889 389629 344499
10000 immediate 14548 172316 257042 173671 200582
10000 revert 14109 162818 245688 370565 332799
And as a percentage vs. the "revert" case:
scale dataset 1 16 32 64 128
---------------------------------------------------------------
100 disabled 101.91% 101.27% 100.01% 101.65% 100.31%
100 immediate 101.81% 97.46% 92.25% 27.06% 38.98%
scale dataset 1 16 32 64 128
---------------------------------------------------------------
3000 disabled 102.21% 100.54% 100.64% 100.62% 102.69%
3000 immediate 102.27% 98.20% 94.15% 29.01% 63.76%
scale dataset 1 16 32 64 128
---------------------------------------------------------------
10000 disabled 101.94% 107.48% 110.26% 105.14% 103.52%
10000 immediate 103.11% 105.83% 104.62% 46.87% 60.27%
I do agree Noah is right that the small (~1-2%) differences may be
simply due to binary layout changes - I haven't taken any steps to
mitigate the influence of that.
The larger differences are however unlikely to be caused by this, I
guess. I mean, the significant performance drop with "immediate" config
and higher client counts is still there, and it's quite massive.
The strange speedup with the feature "disabled" (which gains up to ~10%
compared to the "revert" case with 32 clients) is also still there. I
find that a bit strange, not sure what's the cause here.
Overall, I think this shows that there seems to be no performance
penalty with "disabled" vs. "reverted" - i.e. even with the least
favorable (100% read-only) workload.
Let's see the impact of the patch on variability of results. First, the
(MAX-MIN)/MAX metric:
scale dataset 1 16 32 64 128
---------------------------------------------------------------
100 disabled 9.55% 3.18% 2.84% 4.16% 9.61%
immediate 4.92% 10.96% 4.39% 3.32% 58.95%
revert 4.43% 3.61% 3.01% 13.93% 10.25%
scale dataset 1 16 32 64 128
---------------------------------------------------------------
3000 disabled 13.29% 4.19% 4.52% 9.06% 23.59%
immediate 7.86% 5.93% 3.15% 7.64% 50.41%
revert 12.34% 7.50% 3.99% 10.17% 16.95%
scale dataset 1 16 32 64 128
---------------------------------------------------------------
10000 disabled 9.19% 17.21% 8.85% 8.01% 26.40%
immediate 7.74% 8.29% 8.53% 38.64% 46.09%
revert 4.42% 4.98% 6.58% 12.42% 18.68%
or as a STDDEV/AVERAGE:
scale dataset 1 16 32 64 128
---------------------------------------------------------------
100 disabled 2.34% 0.74% 1.00% 1.20% 2.65%
immediate 1.51% 2.65% 1.11% 0.69% 34.35%
revert 1.47% 0.94% 0.78% 3.22% 2.73%
scale dataset 1 16 32 64 128
---------------------------------------------------------------
3000 disabled 2.93% 1.19% 1.06% 2.04% 6.99%
immediate 2.31% 1.34% 0.88% 1.72% 18.15%
revert 2.81% 1.51% 0.96% 2.64% 4.85%
scale dataset 1 16 32 64 128
---------------------------------------------------------------
10000 disabled 3.56% 4.51% 2.62% 1.73% 7.56%
immediate 2.53% 2.36% 2.82% 15.61% 18.20%
revert 1.41% 1.45% 1.69% 3.16% 6.39%
Whatever the metric is, I think it's fairly clear the patch makes the
results way more volatile - particularly with the "immediate" case and
higher client counts.
I'm not sure whether that's problem with NUMA or one of the bugs in the
kernel scheduler. But even if it is, we should not ignore that as it
will take a long time before most users migrate to fixed kernels.
AFAIK the system is not using autogroups, and I've rebooted it before
repeating the tests to make sure none of the cores were turned off
(e.g. during some experiments with hyper-threading or something). That
should eliminate the related scheduling bugs.
The end of the "numactl --hardware" output looks like this:
node distances:
node 0 1 2 3
0: 10 21 30 21
1: 21 10 21 30
2: 30 21 10 21
3: 21 30 21 10
Which I think means that there may be up to two hops, making the system
vulnerable to the "Scheduling Group Construction" bug. But it seems a
bit strange that it would only affect one of the cases ("immediate").
What I plan to do next, over the next week:
1) Wait for the second run of "immediate" to complete (should happen in
a few hours)
2) Do tests with other workloads (mostly read-only, read-write).
regards
--
Tomas Vondra http://www.2ndQuadrant.com
PostgreSQL Development, 24x7 Support, Remote DBA, Training & Services
Attachment
pgsql-hackers by date: