Thread: Erroneous cost estimation for nested loop join
Hi guys,
I’ve been using Postgres for research at an university, and we found some interesting queries that the optimizer of
Postgreschose wrong query plans. I will describe one example query below.
The query is just a join of two tables, but the optimizer overestimates the cost of a nested loop join plan and selects
ahash join plan which execution time is 3.24 times slower than nested loop join in the worst case.
We investigated the query and we found that the cost model of current Postgres makes a wrong estimation for some nested
loopjoin plans. So we posted this mail for sharing the problem.
## Test environment:
These are machines we used for examination.
・Processor: Intel(R) Xeon(R) CPU E5-2680 0 @ 2.70GHz (8 cores) * 2 sockets
・Memory: 64GB (128MB was allocated for shared_buffers)
・Storage: RAID6 (22D+2P) with 24 NL-SAS 10krpm HDDs
- 19TB in total
- Maximum sequential read throughput: 2.5GB/s (measured by dd command)
・CentOS 5.8 (linux 2.6.18-371.1.2.el5)
・Postgres 9.4.1
- cost parameter calibration: random_page_cost = 92.89
We used two tables from TPC-H(*) benchmark dataset, and modified the join cardinality between orders and lineitem. It
is1:4 originally, but we modified it to 1:10000. So there are 10000 lineitem records per 1 orders record. There are
10,000records in orders, 100,000,000 records in lineitem, and these tables occupy 1,261 MB on disk.
(*)TPC-H is one of benchmark specification that supposes a decision support system (DSS).
## Query
In order to examine the cost estimation error of nested loop join, we measured the cost and the execution time of
followingtwo queries with various selectivity (the value of KEY). And we set the parameters “enable_hashjoin” and
“enable_seqscan”false not to select hash join.
Query1
select sum(l_quantity) from lineitem where l_orderkey <= [KEY];
This is an example of execution plan. (KEY=100)
Aggregate (cost=362288.74..362288.75 rows=1 width=5)
-> Index Scan using l_orderkey_idx2 on lineitem2 (cost=0.57..359788.73 rows=1000000 width=5)
Index Cond: (l_orderkey <= 100)
Query2
select sum(o_totalprice), sum(l_quantity) from orders inner join lineitem on (o_orderkey = l_orderkey) where o_orderkey
<=[KEY];
This is an example of execution plan. (KEY=100)
Aggregate (cost=2296937.99..2296938.00 rows=1 width=14)
-> Nested Loop (cost=0.85..2291887.98 rows=1010000 width=14)
-> Index Scan using orders_pkey2 on orders2 (cost=0.29..188.84 rows=101 width=13)
Index Cond: (o_orderkey <= 100)
-> Index Scan using l_orderkey_idx2 on lineitem2 (cost=0.57..22578.67 rows=11142 width=9)
Index Cond: (l_orderkey = orders2.o_orderkey)
## Results
[Figure1.png]
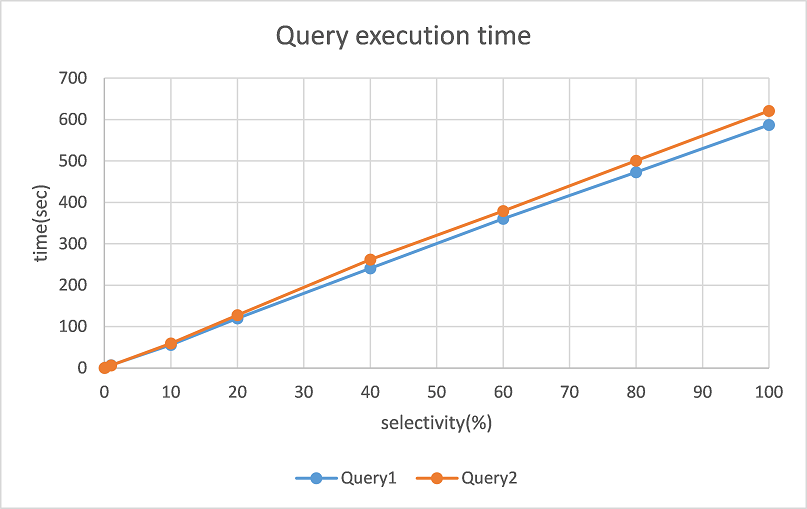
We show the execution time of two queries as Figure 1. In this case, the selectivity is proportional to KEY, and become
100%when KEY=10000.
As we can see from this graph, the execution times of two queries are almost the same. Because the majority of these
costsare lineitem scanning, and the I/O workloads of these two scanning process are nearly identical.
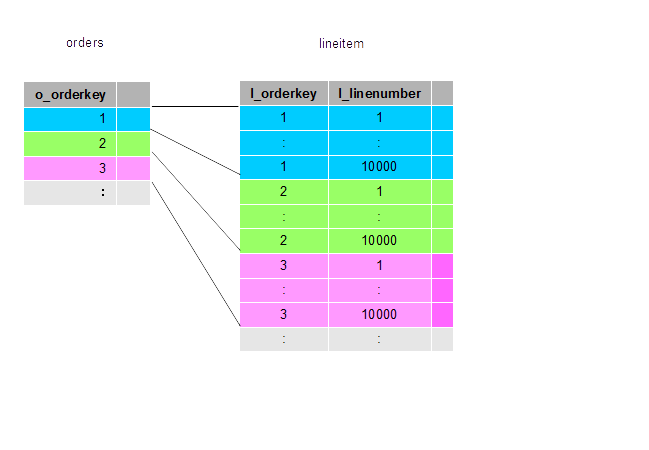
Let me explain more detail why these two workloads are nearly identical. Lineitem has a clustered index on l_orderkey
column,and in Query1, this index is used on scanning lineitem, so I/O workload is sequencial scan of lineitem. In
Query2,this index is also used on scanning inner table (i.e. lineitem) repeatedly on nested loop join. And outer table
(i.e.orders) is scanned by the index on o_orderkey, so the key of inner scan is ordered by l_orderkey. That is to say,
lineitemis substantially scanned from head (Figure 2).
[Figure2.png]
So the I/O cost difference between Query1 and Query2 is the cost to scan outer table (i.e. orders), and it is very
smallbecause the outer table scan cost is very cheap in comparison to the inner table scan cost.
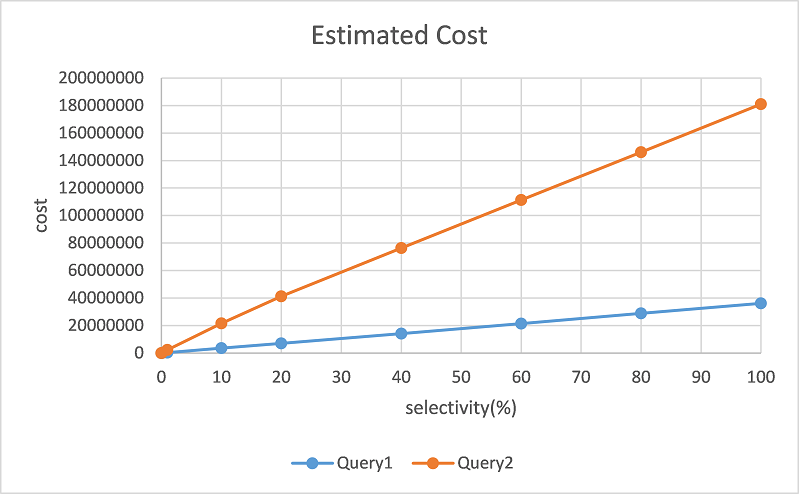
But when we check the cost with explain command, postgres overestimates the cost of Query2. For example, the cost of
Query2is 5 times of Query1 at KEY 10,000
[Figure3.png]
We can find that that the optimizer estimates the different cost value for two queries which have almost the same
executiontime.
So, the optimizer will select hash join even if nested loop is faster, and in the worst case, execution time of hash
joinwill be about 3.24 times of the execution time of nested loop for Query2.
We guessed the cause of this error would be in the cost model of Postgres, and investigated the source code of
optimizer,and we found the cause of this problem. It was in the index cost estimation process. On scanning inner table,
ifloop count is greater than 1, its I/O cost is counted as random access. In the case of Query2, in one loop (i.e. one
innertable scan) , much data is read sequentially with clustered index, so it seems to be wrong that optimizer thinks
itsI/O workload is random access.
Specifically, in function “cost_index” in “costsize.c”, if loop_count > 1, the cost estimate expression is as follows:
min_IO_cost = (pages_fetched * spc_random_page_cost) / loop_count;
We modified this code. The first page is randomly accessed and the rests is sequentially accessed.
min_IO_cost = spc_random_page_cost / (double)loop_count;
if (pages_fetched > 1) {
min_IO_cost += (pages_fetched - 1) * spc_seq_page_cost / loop_count;
}
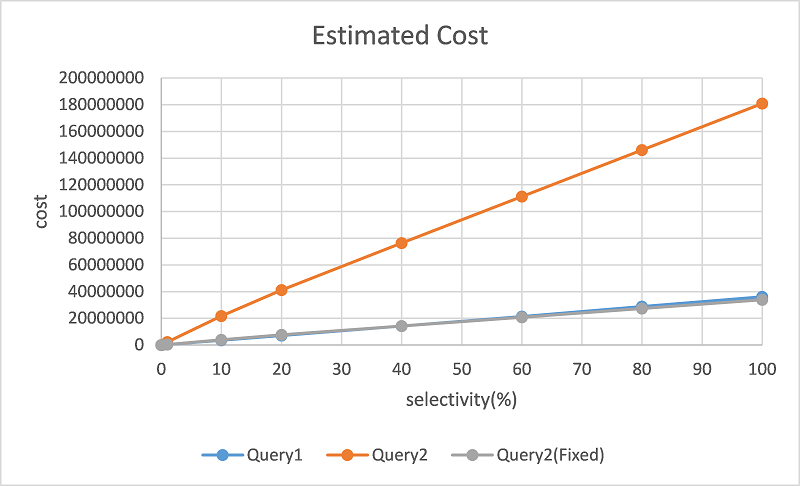
Then we get the modified cost line as Figure 4 (gray line).
[Figure4.png]
As this result shows, the difference between Query1 and Query2(Fixed) is smaller than original one, so the cost
estimationseems to be improved.
There is infinite query space, so this problem is thoroughly an example. To fix only this problem, that is enough to
modifythe code as previous. But we think the optimizer can still have another problems, so we want to hear your opinion
aboutthe problems like this because you have deep knowledge of Postgres. We think the cost model of optimizer is very
interestingfor research, so we want to expand the discussion from this problem, and contribute to Postgres community.
Thanks.
Ryoji
Attachment
On Mon, Nov 9, 2015 at 11:08 AM, <kawamichi@tkl.iis.u-tokyo.ac.jp> wrote:
- cost parameter calibration: random_page_cost = 92.89
This demands some explanation and raises question of value of seq_page_cost parameter -- I don't see anything about it your mail.
--
Alex
On 09/11/15 23:08, kawamichi@tkl.iis.u-tokyo.ac.jp wrote:
> Hi guys,
>
> I’ve been using Postgres for research at an university,
Great!

[...]
> ・Postgres 9.4.1
[..]

More knowledgeable people are sure to reply in more detail!

However, they would probably appreciate it if you can run with 9.4.5
(the latest released version).  Running it with the beta of 9.5 would be
a bonus!

Note that I don't know enough to say for sure that later versions would
make any difference in this case, but at least using later later
versions would kill lots of Red Herrings!  :-)


Cheers,
Gavin
On 9 November 2015 at 10:08, <kawamichi@tkl.iis.u-tokyo.ac.jp> wrote:
--
We guessed the cause of this error would be in the cost model of Postgres, and investigated the source code of optimizer, and we found the cause of this problem. It was in the index cost estimation process. On scanning inner table, if loop count is greater than 1, its I/O cost is counted as random access. In the case of Query2, in one loop (i.e. one inner table scan) , much data is read sequentially with clustered index, so it seems to be wrong that optimizer thinks its I/O workload is random access.
We don't have a clustered index in Postgres. We do store correlation stats for the index, which is used in some places to reduce cost.
Could you look some more at this and see if a model change that uses the correlation can improve this?
Simon Riggs http://www.2ndQuadrant.com/
PostgreSQL Development, 24x7 Support, Remote DBA, Training & Services
PostgreSQL Development, 24x7 Support, Remote DBA, Training & Services
kawamichi@tkl.iis.u-tokyo.ac.jp writes:
>       - cost parameter calibration: random_page_cost = 92.89

TBH, you lost me there already.  I know of no hardware on which that would
be a sane depiction of reality, so I think you've probably overfitted the
model to some particular case it was already inaccurate on.  Any results
you're getting using this setting will likely fall into the category of
"garbage in, garbage out".

What led you to choose that number?
        regards, tom lane
<tgl@sss.pgh.pa.us> wrote:
>
> TBH, you lost me there already.  I know of no hardware on which that would
> be a sane depiction of reality, so I think you've probably overfitted the
> model to some particular case it was already inaccurate on.  Any results
> you're getting using this setting will likely fall into the category of
> "garbage in, garbage out".
>
> What led you to choose that number?

Uh, it seems that the scale of our machine caused confusion.
It has a bit large disk array, and I think random_page_cost = 92.89 is reasonable
(the reason is described later).

This problem could be observed in normal environment like random_page_cost = 4.
I checked estimated cost of query (1) and query (2) with random_page_cost = 4,
and there were noticeable cost estimation difference between them (see an attached graph).
As I explained in the first mail, execution time of query (1) and query (2) are
expected to be almost the same. If so, there is something wrong with cost estimation
logic, and this problem is not specific to particular environment. The result I
showed was just an example of confirmation of the problem.


Next, I'd like to explain our environment and the reason of random_page_cost value.
Our machine has a RAID6 array with 24 NL-SAS HDDs and its raw I/O performance is:
   Sequential access:  2.5GB/s
   Random access (8KB block): 1.6MB/s (=200 IOPS * 8KB )

For Postgres, we have filesystems and some calculations like tuple processing or
aggregations, so sequential access becomes slower. Here I show basic performance
values of I/O intensive queries like simple scan on a large table:
   Sequential access:  200-300MB/s(*)
   Random access: 200 IOPS * 8KB = 1.6MB/s
      (*) depends on aggregation or any other calculations

So sequential access is 125-188 times faster than random access. We assume OLAP
workload, so cache hit ratio is not so high. That means performance gap between
sequential I/O and random I/O would not be mitigated by cache effect.
Therefore we think random_page_cost should be around 100 in our environment.

random_page_cost = 92.89 is the result of calibration with multiple TPC-H queries,
which covers from simple scan on single table to complex joins of multiple tables,
and this value gives good cost estimation for TPC-H queries.

Thanks.
Ryoji
Attachment
<oleksandr.shulgin@zalando.de> wrote:
>>
>>       - cost parameter calibration: random_page_cost = 92.89
>>
>
> This demands some explanation and raises question of value of seq_page_cost
> parameter -- I don't see anything about it your mail.

seq_page_cost was set to 1.0 (default), and I explained the reason about random_page_cost value in reply to Tom.
Please see it.

Thanks
Ryoji
<GavinFlower@archidevsys.co.nz> wrote:
>
> More knowledgeable people are sure to reply in more detail!
>
> However, they would probably appreciate it if you can run with 9.4.5
> (the latest released version).  Running it with the beta of 9.5 would be
> a bonus!
>
> Note that I don't know enough to say for sure that later versions would
> make any difference in this case, but at least using later later
> versions would kill lots of Red Herrings!  :-)
>

Difference between minor versions does not matter in this case. I confirmed
the cost calculation logic regarding this problem was not changed between
Postgres 9.4.1 and 9.4.5.

I heard there are some performance improvements on 9.5. It might change
something regarding this problem. so I will try these queries on 9.5!

Thanks
Ryoji
<simon@2ndQuadrant.com> wrote:
>>
>> We guessed the cause of this error would be in the cost model of Postgres,
>> and investigated the source code of optimizer, and we found the cause of
>> this problem. It was in the index cost estimation process. On scanning
>> inner table, if loop count is greater than 1, its I/O cost is counted as
>> random access. In the case of Query2, in one loop (i.e. one inner table
>> scan) , much data is read sequentially with clustered index, so it seems to
>> be wrong that optimizer thinks its I/O workload is random access.
>>
>
> We don't have a clustered index in Postgres. We do store correlation stats
> for the index, which is used in some places to reduce cost.

Yes, postgres does not have a clustered index as you pointed. I meant an index
whose correlation is 1.0 by using word “clustered index”. In this case,
the index is primary key (records are physically ordered by this) and the index
was created just after the whole data was loaded. We’ve been assuming OLAP
workload for our experiments, so I think correlation = 1.0 is the basic case
for our experiments.

> Could you look some more at this and see if a model change that uses the
> correlation can improve this?

I cannot understand the question so let me clarify. Did you mean that I should
read the optimizer code more, and I can find the correlation is used to improve
cost estimation?

Of course I read them, and I know that correlation is used to determine
the value between the min cost and max cost. (The min cost is the best case
cost (i.e. correlation is 1.0), and the max cost is the worst case cost (i.e.
correlation is 0).

But in both case, I/O cost is counted as random access on scanning inner table.
I think I/O cost should be counted as sequential access when the correlation is
1.0, so I tried to modify the code as previous mail. But this modification is
just an example of solution. I’m not so familiar with optimizer code yet, so
I’m wondering this is the right way or not.

Thank you for your comment.
Ryoji
On Mon, Nov 9, 2015 at 2:42 AM, Simon Riggs <simon@2ndquadrant.com> wrote:
> On 9 November 2015 at 10:08, <kawamichi@tkl.iis.u-tokyo.ac.jp> wrote:
>>
>>
>> We guessed the cause of this error would be in the cost model of Postgres,
>> and investigated the source code of optimizer, and we found the cause of
>> this problem. It was in the index cost estimation process. On scanning inner
>> table, if loop count is greater than 1, its I/O cost is counted as random
>> access. In the case of Query2, in one loop (i.e. one inner table scan) ,
>> much data is read sequentially with clustered index, so it seems to be wrong
>> that optimizer thinks its I/O workload is random access.
>
>
> We don't have a clustered index in Postgres. We do store correlation stats
> for the index, which is used in some places to reduce cost.
>
> Could you look some more at this and see if a model change that uses the
> correlation can improve this?

That is already happening.  min_IO_cost is set on the assumption of
perfect correlation, max_IO_cost is set on the assumption of no
correlation, and then later in the code it interpolates between these
two based on the observed correlation:

run_cost += max_IO_cost + csquared * (min_IO_cost - max_IO_cost);

But the min_IO_cost is very pessimistic in this particular case.  So I
think that their proposed change is already exactly what you are
asking them to try.

Cheers,

Jeff
On Mon, Nov 9, 2015 at 6:37 AM, Tom Lane <tgl@sss.pgh.pa.us> wrote:
> kawamichi@tkl.iis.u-tokyo.ac.jp writes:
>>       - cost parameter calibration: random_page_cost = 92.89
>
> TBH, you lost me there already.  I know of no hardware on which that would
> be a sane depiction of reality, so I think you've probably overfitted the
> model to some particular case it was already inaccurate on.

I can easily get a ratio of random to sequential of 50, and my RAID is
nothing special.  I don't see why a high-end RAID couldn't justify 100
or more, as long as they know the cache-hit is very low. (The default
value of 4 seems to bake in the notion that 90% of even random IO is
going to be satisfied from the cache, which might be a good estimate
if you have frequently used smallish lookup tables that always get
joined to the RAM-busters, but some people aren't going to have that
type of database queries as their main load).

With the current code, a single scan out of several can get estimated
to have a higher cost than just a free-standing single scan
(loop_count > 1), and I don't see how that can ever make sense.

Right now it can only benefit from assumed cache hits (driven by
effective_cache_size) via Mackert and Lohman.

I think that, at least, it should get to claim the greater of either
the Mackert and Lohman benefit between inner scans, or the benefit of
converting some random IO to sequential within each separate inner
scan.

And really, I don't see why it should not get both benefits.  If the
pages are still in cache between inner scans, that's great.  But if
the one time they do need to be read in from disk they are read in
mostly sequentially, why is that benefit not also fully justified? I
don't see where the worry about "double-counting the cache effects"
comes from.  The effective_cache_size and io read-ahead can both apply
and both give benefits simultaneously and cumulatively.

Cheers,

Jeff
On Mon, Nov 16, 2015 at 6:50 PM, Jeff Janes <jeff.janes@gmail.com> wrote:
> On Mon, Nov 9, 2015 at 6:37 AM, Tom Lane <tgl@sss.pgh.pa.us> wrote:
>> kawamichi@tkl.iis.u-tokyo.ac.jp writes:
>>>       - cost parameter calibration: random_page_cost = 92.89
>>
>> TBH, you lost me there already.  I know of no hardware on which that would
>> be a sane depiction of reality, so I think you've probably overfitted the
>> model to some particular case it was already inaccurate on.
>
> I can easily get a ratio of random to sequential of 50, and my RAID is
> nothing special.  I don't see why a high-end RAID couldn't justify 100
> or more, as long as they know the cache-hit is very low. (The default
> value of 4 seems to bake in the notion that 90% of even random IO is
> going to be satisfied from the cache, which might be a good estimate
> if you have frequently used smallish lookup tables that always get
> joined to the RAM-busters, but some people aren't going to have that
> type of database queries as their main load).

I agree.  What I've been thinking about is:

- If we're sequential scanning a small table, let's say less than 1/4
of shared_buffers, which is the point where synchronized scans kick
in, then assume the data is coming from shared_buffers.
- If we're scanning a medium-sized table, let's say less than
effective_cache_size, then assume the data is coming from the OS
cache.  Maybe this is the same cost as the previous case, or maybe
it's slightly more.
- Otherwise, assume that the first effective_cache_size pages are
coming from cache and the rest has to be read from disk.  This is
perhaps unrealistic, but we don't want the cost curve to be
discontinuous.

The effect of this would be that sequential scanning a small table
would look cheaper per page than sequential scanning a large table,
which is a good idea, because it's likely to be true.  Similar
adaptations could be made for index scans, index-only scans, bitmap
index scans, and bitmap heap scans.  The default value of
random_page_cost would go up, but there would be a new
cached_page_cost GUC that would apply in some cases where
seq_page_cost and/or random_page_cost apply today.

Previous attempts to improve the modeling of cache effects have
faltered because we don't know what will be cached at execution time,
and even if we did it can change very quickly and we don't want plan
instability.  But it seems to me that guessing based on the size of
the relation is pretty reasonable - essentially we'd be trying to
refine a model which says that every page is equally likely to be
cached, and that shouldn't be too high a bar to clear.

A problem with this sort of thing, of course, is that it's really hard
to test a proposed change broadly enough to be certain how it will
play out in the real world.

--
Robert Haas
EnterpriseDB: http://www.enterprisedb.com
The Enterprise PostgreSQL Company
Robert Haas <robertmhaas@gmail.com> wrote:
>
> - If we're sequential scanning a small table, let's say less than 1/4
> of shared_buffers, which is the point where synchronized scans kick
> in, then assume the data is coming from shared_buffers.
> - If we're scanning a medium-sized table, let's say less than
> effective_cache_size, then assume the data is coming from the OS
> cache.  Maybe this is the same cost as the previous case, or maybe
> it's slightly more.
> - Otherwise, assume that the first effective_cache_size pages are
> coming from cache and the rest has to be read from disk.  This is
> perhaps unrealistic, but we don't want the cost curve to be
> discontinuous.

I think this improvement is so reasonable, and I expect it will be merged
into current optimizer code.


> A problem with this sort of thing, of course, is that it's really hard
> to test a proposed change broadly enough to be certain how it will
> play out in the real world.

That’s the problem we’re really interested in and trying to tackle.

For example, with extensive experiments, I’m really sure my modification of
cost model is effective for our environment, but I can’t see if it is also
efficient or unfortunately harmful in general environments.

And I think that, in postgres community, there must be (maybe buried)
knowledge on how to judge the effectiveness of cost model modifications
because someone should have considered something like that at each commit.
I’m interested in it, and hopefully would like to contribute to finding
a better way to improve the optimizer through cost model refinement.

Thanks.
Ryoji.
On Mon, Nov 30, 2015 at 04:29:43PM +0900, KAWAMICHI Ryoji wrote:
>
>
> Robert Haas <robertmhaas@gmail.com> wrote:
> >
> > - If we're sequential scanning a small table, let's say less than 1/4
> > of shared_buffers, which is the point where synchronized scans kick
> > in, then assume the data is coming from shared_buffers.
> > - If we're scanning a medium-sized table, let's say less than
> > effective_cache_size, then assume the data is coming from the OS
> > cache.  Maybe this is the same cost as the previous case, or maybe
> > it's slightly more.
> > - Otherwise, assume that the first effective_cache_size pages are
> > coming from cache and the rest has to be read from disk.  This is
> > perhaps unrealistic, but we don't want the cost curve to be
> > discontinuous.
>
> I think this improvement is so reasonable, and I expect it will be merged
> into current optimizer code.
>
>
> > A problem with this sort of thing, of course, is that it's really hard
> > to test a proposed change broadly enough to be certain how it will
> > play out in the real world.
>
> That’s the problem we’re really interested in and trying to tackle.
>
> For example, with extensive experiments, I’m really sure my modification of
> cost model is effective for our environment, but I can’t see if it is also
> efficient or unfortunately harmful in general environments.
>
> And I think that, in postgres community, there must be (maybe buried)
> knowledge on how to judge the effectiveness of cost model modifications
> because someone should have considered something like that at each commit.
> I’m interested in it, and hopefully would like to contribute to finding
> a better way to improve the optimizer through cost model refinement.

No one mentioned the random page docs so I will quote it here:
http://www.postgresql.org/docs/9.5/static/runtime-config-query.html#RUNTIME-CONFIG-QUERY-CONSTANTS
Random access to mechanical disk storage is normally much more expensivethan four times sequential access. However, a
lowerdefault is used(4.0) because the majority of random accesses to disk, such as indexedreads, are assumed to be in
cache.The default value can be thought ofas modeling random access as 40 times slower than sequential, whileexpecting
90%of random reads to be cached.If you believe a 90% cache rate is an incorrect assumption for yourworkload, you can
increaserandom_page_cost to better reflect the truecost of random storage reads. Correspondingly, if your data is
likelytobe completely in cache, such as when the database is smaller than thetotal server memory, decreasing
random_page_costcan be appropriate.Storage that has a low random read cost relative to sequential, e.g.solid-state
drives,might also be better modeled with a lower value forrandom_page_cost.


What we don't have is way to know how much is in the cache, not only at
planning time, but at execution time.  (Those times are often
different for prepared queries.)  I think that is the crux of what has
to be addressed here.

--  Bruce Momjian  <bruce@momjian.us>        http://momjian.us EnterpriseDB
http://enterprisedb.com

+ As you are, so once was I. As I am, so you will be. +
+ Roman grave inscription                             +
On Wed, Dec 2, 2015 at 8:42 PM, Bruce Momjian <bruce@momjian.us> wrote:
> No one mentioned the random page docs so I will quote it here:
>
>         http://www.postgresql.org/docs/9.5/static/runtime-config-query.html#RUNTIME-CONFIG-QUERY-CONSTANTS
>
>         Random access to mechanical disk storage is normally much more expensive
>         than four times sequential access. However, a lower default is used
>         (4.0) because the majority of random accesses to disk, such as indexed
>         reads, are assumed to be in cache. The default value can be thought of
>         as modeling random access as 40 times slower than sequential, while
>         expecting 90% of random reads to be cached.
>
>         If you believe a 90% cache rate is an incorrect assumption for your
>         workload, you can increase random_page_cost to better reflect the true
>         cost of random storage reads. Correspondingly, if your data is likely to
>         be completely in cache, such as when the database is smaller than the
>         total server memory, decreasing random_page_cost can be appropriate.
>         Storage that has a low random read cost relative to sequential, e.g.
>         solid-state drives, might also be better modeled with a lower value for
>         random_page_cost.
>
> What we don't have is way to know how much is in the cache, not only at
> planning time, but at execution time.  (Those times are often
> different for prepared queries.)  I think that is the crux of what has
> to be addressed here.

I think that paragraph is more of an apology for the system that we've
got than a description of what a good one would look like.  If I have
a 1MB table and a 1TB, they are not equally likely to be cached.

--
Robert Haas
EnterpriseDB: http://www.enterprisedb.com
The Enterprise PostgreSQL Company