Thread: Optimize WindowAgg's use of tuplestores
As part of making tuplestores faster [1], I noticed that in WindowAgg, when we end one partition we call tuplestore_end() and then we do tuplestore_begin_heap() again for the next partition in begin_partition() and then go on to set up the tuplestore read pointers according to what's required for the given frameOptions of the WindowAgg. This might make sense if the frameOptions could change between partitions, but they can't, so I don't see any reason why we can't just do tuplestore_clear() at the end of a partition. That resets the read pointer positions back to the start again ready for the next partition.
I wrote the attached patch and checked how it affects performance. It helps quite a bit when there are lots of partitions.
CREATE TABLE a (a INT NOT NULL);
INSERT INTO a SELECT x FROM generate_series(1,1000000)x;
VACUUM FREEZE ANALYZE a;
bench.sql:
SELECT a,count(*) OVER (PARTITION BY a) FROM a OFFSET 1000000;
master:
$ pgbench -n -f bench.sql -T 60 -M prepared postgres | grep latency
latency average = 293.488 ms
latency average = 295.509 ms
latency average = 297.772 ms
latency average = 293.488 ms
latency average = 295.509 ms
latency average = 297.772 ms
patched:
$ pgbench -n -f bench.sql -T 60 -M prepared postgres | grep latency
latency average = 203.234 ms
latency average = 204.538 ms
latency average = 203.877 ms
latency average = 203.234 ms
latency average = 204.538 ms
latency average = 203.877 ms
About 45% faster.
Here's the top of perf top of each:
master:
8.61% libc.so.6 [.] _int_malloc
6.71% libc.so.6 [.] _int_free
6.42% postgres [.] heap_form_minimal_tuple
6.40% postgres [.] tuplestore_alloc_read_pointer
5.87% libc.so.6 [.] unlink_chunk.constprop.0
3.86% libc.so.6 [.] __memmove_avx512_unaligned_erms
3.80% postgres [.] AllocSetFree
3.51% postgres [.] spool_tuples
3.45% postgres [.] ExecWindowAgg
2.09% postgres [.] tuplesort_puttuple_common
1.92% postgres [.] comparetup_datum
1.88% postgres [.] AllocSetAlloc
1.85% postgres [.] tuplesort_heap_replace_top
1.84% postgres [.] ExecStoreBufferHeapTuple
1.69% postgres [.] window_gettupleslot
patched:
8.95% postgres [.] ExecWindowAgg
8.10% postgres [.] heap_form_minimal_tuple
5.16% postgres [.] spool_tuples
4.03% libc.so.6 [.] __memmove_avx512_unaligned_erms
4.02% postgres [.] begin_partition
3.11% postgres [.] tuplesort_puttuple_common
2.97% postgres [.] AllocSetAlloc
2.96% postgres [.] comparetup_datum
2.83% postgres [.] tuplesort_heap_replace_top
2.79% postgres [.] window_gettupleslot
2.22% postgres [.] AllocSetFree
2.11% postgres [.] MemoryContextReset
1.99% postgres [.] LogicalTapeWrite
1.98% postgres [.] advance_windowaggregate
Lots less malloc/free work going on.
I'm also tempted to do a cleanup of the state machine inside nodeWindowAgg.c as I had to add another bool flag to WindowAggState to replace the previous test that checked if the tuplestore was empty (i.e just finished a partition) with if (winstate->buffer == NULL). I couldn't do that anymore due to no longer nullifying that field. I think such a cleanup would be a separate patch. Annoyingly the extra bool is the 9th bool flag and widens that struct by 8 bytes and leaves a 7 byte hole.
David
Attachment
On Sun, Jul 7, 2024 at 4:27 PM David Rowley <dgrowley@gmail.com> wrote:
>
> As part of making tuplestores faster [1], I noticed that in WindowAgg, when we end one partition we call
tuplestore_end()and then we do tuplestore_begin_heap() again for the next partition in begin_partition() and then go on
toset up the tuplestore read pointers according to what's required for the given frameOptions of the WindowAgg.  This
mightmake sense if the frameOptions could change between partitions, but they can't, so I don't see any reason why we
can'tjust do tuplestore_clear() at the end of a partition.  That resets the read pointer positions back to the start
againready for the next partition.
>
> I wrote the attached patch and checked how it affects performance. It helps quite a bit when there are lots of
partitions.
>
> CREATE TABLE a (a INT NOT NULL);
> INSERT INTO a SELECT x FROM generate_series(1,1000000)x;
> VACUUM FREEZE ANALYZE a;
>
> bench.sql:
> SELECT a,count(*) OVER (PARTITION BY a) FROM a OFFSET 1000000;
>
> master:
> $ pgbench -n -f bench.sql -T 60 -M prepared postgres | grep latency
> latency average = 293.488 ms
> latency average = 295.509 ms
> latency average = 297.772 ms
>
> patched:
> $ pgbench -n -f bench.sql -T 60 -M prepared postgres | grep latency
> latency average = 203.234 ms
> latency average = 204.538 ms
> latency average = 203.877 ms
>
> About 45% faster.
>

I repeated your measurements but by varying the number of partitions
and repeating pgbench 5 times instead of 3. The idea is to see the
impact of the change on a lower number of partitions.

10 partitions query: SELECT a,count(*) OVER (PARTITION BY a % 10) FROM
a OFFSET 1000000;
100 partitions query: SELECT a,count(*) OVER (PARTITION BY a % 100)
FROM a OFFSET 1000000;
1000 partitions query: SELECT a,count(*) OVER (PARTITION BY a % 1000)
FROM a OFFSET 1000000;
original query with 1M partitions: SELECT a,count(*) OVER (PARTITION
BY a) FROM a OFFSET 1000000;
Notice that the offset is still the same to avoid any impact it may
have on the query execution.

Here are the results
master:
no. of partitions, average latencies
10, 362.166 ms, 369.313 ms, 375.203 ms, 368.798 ms, 372.483 ms
100, 372.885 ms, 381.463 ms, 385.372 ms, 382.915 ms, 383.630 ms
1000, 390.834 ms, 395.653 ms, 400.339 ms, 407.777 ms, 389.906 ms
1000000, 552.848 ms, 553.943 ms, 547.806 ms, 541.871 ms, 546.741 ms

patched
10, 356.980 ms, 371.223 ms, 375.550 ms, 378.011 ms, 381.119 ms
100, 392.307 ms, 385.087 ms, 380.383 ms, 390.999 ms, 388.422 ms
1000, 405.136 ms, 397.576 ms, 399.021 ms, 399.572 ms, 406.604 ms
1000000, 394.711 ms, 403.741 ms, 399.008 ms, 392.932 ms, 393.335 ms

Observations
1. The numbers corresponding to 10 and 100 partitions are higher when
patched. That might be just noise. I don't see any reason why it would
impact negatively when there are a small number of partitions. The
lower partition cases also have a higher number of rows per partition,
so is the difference between MemoryContextDelete() vs
MemoryContextReset() making any difference here. May be worth
verifying those cases carefully. Otherwise upto 1000 partitions, it
doesn't show any differences.
2.  For 1M partitions it does make a difference. About 35% in my case.
Moreover the change seems to be making the execution times independent
of the number of partitions (more or less).

Combining this observation with the first one, It might be worth
looking at the execution times when there are many rows per partition
in case of a higher number of partitions.

--
Best Wishes,
Ashutosh Bapat
On Wed, 10 Jul 2024 at 02:42, Ashutosh Bapat
<ashutosh.bapat.oss@gmail.com> wrote:
> Observations
> 1. The numbers corresponding to 10 and 100 partitions are higher when
> patched. That might be just noise. I don't see any reason why it would
> impact negatively when there are a small number of partitions. The
> lower partition cases also have a higher number of rows per partition,
> so is the difference between MemoryContextDelete() vs
> MemoryContextReset() making any difference here. May be worth
> verifying those cases carefully. Otherwise upto 1000 partitions, it
> doesn't show any differences.

I think this might just be noise as a result of rearranging code. In
terms of C code, I don't see any reason for it to be slower.  If you
look at GenerationDelete() (as what is getting called from
MemoryContextDelete()), it just calls GenerationReset(). So resetting
is going to always be less work than deleting the context, especially
given we don't need to create the context again when we reset it.

I wrote the attached script to see if I can also see the slowdown and
I do see the patched code come out slightly slower (within noise
levels) in lower partition counts.

To get my compiler to produce code in a more optimal order for the
common case, I added unlikely() to the "if (winstate->all_first)"
condition.  This is only evaluated on the first time after a rescan,
so putting that code at the end of the function makes more sense.  The
attached v2 patch has it this way.  You can see the numbers look
slightly better in the attached graph.

Thanks for having a look at this.

David
Attachment
Em qui., 11 de jul. de 2024 às 09:09, David Rowley <dgrowleyml@gmail.com> escreveu:
On Wed, 10 Jul 2024 at 02:42, Ashutosh Bapat
<ashutosh.bapat.oss@gmail.com> wrote:
> Observations
> 1. The numbers corresponding to 10 and 100 partitions are higher when
> patched. That might be just noise. I don't see any reason why it would
> impact negatively when there are a small number of partitions. The
> lower partition cases also have a higher number of rows per partition,
> so is the difference between MemoryContextDelete() vs
> MemoryContextReset() making any difference here. May be worth
> verifying those cases carefully. Otherwise upto 1000 partitions, it
> doesn't show any differences.
I think this might just be noise as a result of rearranging code. In
terms of C code, I don't see any reason for it to be slower. If you
look at GenerationDelete() (as what is getting called from
MemoryContextDelete()), it just calls GenerationReset(). So resetting
is going to always be less work than deleting the context, especially
given we don't need to create the context again when we reset it.
I wrote the attached script to see if I can also see the slowdown and
I do see the patched code come out slightly slower (within noise
levels) in lower partition counts.
To get my compiler to produce code in a more optimal order for the
common case, I added unlikely() to the "if (winstate->all_first)"
condition. This is only evaluated on the first time after a rescan,
so putting that code at the end of the function makes more sense. The
attached v2 patch has it this way.
Not that it's going to make any difference,
but since you're going to touch this code, why not?
Function *begin_partition*:
1. You can reduce the scope for variable *outerPlan*,
it is not needed anywhere else.
+ /*
+ * If this is the very first partition, we need to fetch the first input
+ * row to store in first_part_slot.
+ */
+ if (TupIsNull(winstate->first_part_slot))
+ {
+ PlanState *outerPlan = outerPlanState(winstate);
+ TupleTableSlot *outerslot = ExecProcNode(outerPlan);
+ * If this is the very first partition, we need to fetch the first input
+ * row to store in first_part_slot.
+ */
+ if (TupIsNull(winstate->first_part_slot))
+ {
+ PlanState *outerPlan = outerPlanState(winstate);
+ TupleTableSlot *outerslot = ExecProcNode(outerPlan);
2. There is once reference to variable numFuncs
You can reduce the scope.
+ /* reset mark and seek positions for each real window function */
+ for (int i = 0; i < winstate->numfuncs; i++)
+ for (int i = 0; i < winstate->numfuncs; i++)
Function *prepare_tuplestore. *
1. There is once reference to variable numFuncs
You can reduce the scope.
/* create mark and read pointers for each real window function */
- for (i = 0; i < numfuncs; i++)
+ for (int i = 0; i < winstate->numfuncs; i++)
- for (i = 0; i < numfuncs; i++)
+ for (int i = 0; i < winstate->numfuncs; i++)
2. You can securely initialize the default value for variable *winstate->grouptail_ptr*
in *else* part.
if ((frameOptions & (FRAMEOPTION_EXCLUDE_GROUP |
FRAMEOPTION_EXCLUDE_TIES)) &&
node->ordNumCols != 0)
winstate->grouptail_ptr =
tuplestore_alloc_read_pointer(winstate->buffer, 0);
}
+ else
+ winstate->grouptail_ptr = -1;
FRAMEOPTION_EXCLUDE_TIES)) &&
node->ordNumCols != 0)
winstate->grouptail_ptr =
tuplestore_alloc_read_pointer(winstate->buffer, 0);
}
+ else
+ winstate->grouptail_ptr = -1;
best regards,
Ranier Vilela
Hi David,

Thank you for the patch.

> I think this might just be noise as a result of rearranging code. In
> terms of C code, I don't see any reason for it to be slower.  If you
> look at GenerationDelete() (as what is getting called from
> MemoryContextDelete()), it just calls GenerationReset(). So resetting
> is going to always be less work than deleting the context, especially
> given we don't need to create the context again when we reset it.
>
> I wrote the attached script to see if I can also see the slowdown and
> I do see the patched code come out slightly slower (within noise
> levels) in lower partition counts.
>
> To get my compiler to produce code in a more optimal order for the
> common case, I added unlikely() to the "if (winstate->all_first)"
> condition.  This is only evaluated on the first time after a rescan,
> so putting that code at the end of the function makes more sense.  The
> attached v2 patch has it this way.  You can see the numbers look
> slightly better in the attached graph.
>
> Thanks for having a look at this.
>
> David

@@ -2684,6 +2726,14 @@ ExecEndWindowAgg(WindowAggState *node)
     PlanState  *outerPlan;
     int            i;

+    if (node->buffer != NULL)
+    {
+        tuplestore_end(node->buffer);
+
+        /* nullify so that release_partition skips the tuplestore_clear() */
+        node->buffer = NULL;
+    }
+

Is it possible that node->buffer == NULL in ExecEndWindowAgg()?  If
not, probably making it an Assert() or just removing the if() should
be fine.

Best reagards,
--
Tatsuo Ishii
SRA OSS LLC
English: http://www.sraoss.co.jp/index_en/
Japanese:http://www.sraoss.co.jp
> @@ -2684,6 +2726,14 @@ ExecEndWindowAgg(WindowAggState *node)
>      PlanState  *outerPlan;
>      int            i;
>
> +    if (node->buffer != NULL)
> +    {
> +        tuplestore_end(node->buffer);
> +
> +        /* nullify so that release_partition skips the tuplestore_clear() */
> +        node->buffer = NULL;
> +    }
> +
>
> Is it possible that node->buffer == NULL in ExecEndWindowAgg()?  If
> not, probably making it an Assert() or just removing the if() should
> be fine.

Of course it it possible, for example there's no row in a partition.
Sorry for noise.

Best reagards,
--
Tatsuo Ishii
SRA OSS LLC
English: http://www.sraoss.co.jp/index_en/
Japanese:http://www.sraoss.co.jp
On Thu, Jul 11, 2024 at 5:39 PM David Rowley <dgrowleyml@gmail.com> wrote:
>
> On Wed, 10 Jul 2024 at 02:42, Ashutosh Bapat
> <ashutosh.bapat.oss@gmail.com> wrote:
> > Observations
> > 1. The numbers corresponding to 10 and 100 partitions are higher when
> > patched. That might be just noise. I don't see any reason why it would
> > impact negatively when there are a small number of partitions. The
> > lower partition cases also have a higher number of rows per partition,
> > so is the difference between MemoryContextDelete() vs
> > MemoryContextReset() making any difference here. May be worth
> > verifying those cases carefully. Otherwise upto 1000 partitions, it
> > doesn't show any differences.
>
> I think this might just be noise as a result of rearranging code. In
> terms of C code, I don't see any reason for it to be slower.  If you
> look at GenerationDelete() (as what is getting called from
> MemoryContextDelete()), it just calls GenerationReset(). So resetting
> is going to always be less work than deleting the context, especially
> given we don't need to create the context again when we reset it.
>
> I wrote the attached script to see if I can also see the slowdown and
> I do see the patched code come out slightly slower (within noise
> levels) in lower partition counts.
>
> To get my compiler to produce code in a more optimal order for the
> common case, I added unlikely() to the "if (winstate->all_first)"
> condition.  This is only evaluated on the first time after a rescan,
> so putting that code at the end of the function makes more sense.  The
> attached v2 patch has it this way.  You can see the numbers look
> slightly better in the attached graph.

The change to all_first seems unrelated to the tuplestore
optimization. But it's bringing the results inline with the master for
lower number of partitions.

Thanks for the script. I have similar results on my laptop.
From master
Testing with 1000000 partitions
latency average = 505.738 ms
latency average = 509.407 ms
latency average = 522.461 ms
Testing with 100000 partitions
latency average = 329.026 ms
latency average = 327.504 ms
latency average = 342.556 ms
Testing with 10000 partitions
latency average = 299.496 ms
latency average = 298.266 ms
latency average = 306.773 ms
Testing with 1000 partitions
latency average = 299.006 ms
latency average = 302.188 ms
latency average = 301.701 ms
Testing with 100 partitions
latency average = 305.411 ms
latency average = 286.935 ms
latency average = 302.432 ms
Testing with 10 partitions
latency average = 288.091 ms
latency average = 294.506 ms
latency average = 305.082 ms
Testing with 1 partitions
latency average = 301.121 ms
latency average = 319.615 ms
latency average = 301.141 ms

Patched
Testing with 1000000 partitions
latency average = 351.683 ms
latency average = 352.516 ms
latency average = 352.086 ms
Testing with 100000 partitions
latency average = 300.626 ms
latency average = 303.584 ms
latency average = 306.959 ms
Testing with 10000 partitions
latency average = 289.560 ms
latency average = 302.248 ms
latency average = 297.423 ms
Testing with 1000 partitions
latency average = 308.600 ms
latency average = 299.215 ms
latency average = 289.681 ms
Testing with 100 partitions
latency average = 301.216 ms
latency average = 286.240 ms
latency average = 291.232 ms
Testing with 10 partitions
latency average = 305.260 ms
latency average = 296.707 ms
latency average = 300.266 ms
Testing with 1 partitions
latency average = 316.199 ms
latency average = 314.043 ms
latency average = 309.425 ms

Now that you are also seeing the slowdown with your earlier patch, I
am wondering whether adding unlikely() by itself is a good
optimization. There might be some other reason behind the perceived
slowdown. How do the numbers look when you just add unlikely() without
any other changes?

--
Best Wishes,
Ashutosh Bapat
On Fri, Jul 12, 2024 at 11:59 AM Ashutosh Bapat
<ashutosh.bapat.oss@gmail.com> wrote:
>
>
> Now that you are also seeing the slowdown with your earlier patch, I
> am wondering whether adding unlikely() by itself is a good
> optimization. There might be some other reason behind the perceived
> slowdown. How do the numbers look when you just add unlikely() without
> any other changes?

Out of curiosity, I measured the performance with just the "unlikely"
change and with the full patch. Below are the results
Testing with 1000000 partitions
latency average = 503.321 ms
latency average = 510.365 ms
latency average = 512.117 ms
Testing with 100000 partitions
latency average = 371.764 ms
latency average = 361.202 ms
latency average = 360.529 ms
Testing with 10000 partitions
latency average = 327.495 ms
latency average = 327.334 ms
latency average = 325.925 ms
Testing with 1000 partitions
latency average = 319.290 ms
latency average = 318.709 ms
latency average = 318.013 ms
Testing with 100 partitions
latency average = 317.756 ms
latency average = 318.933 ms
latency average = 316.529 ms
Testing with 10 partitions
latency average = 316.392 ms
latency average = 315.297 ms
latency average = 316.007 ms
Testing with 1 partitions
latency average = 330.978 ms
latency average = 330.529 ms
latency average = 333.538 ms

with just unlikely change
Testing with 1000000 partitions
latency average = 504.786 ms
latency average = 507.557 ms
latency average = 508.522 ms
Testing with 100000 partitions
latency average = 316.345 ms
latency average = 315.496 ms
latency average = 326.503 ms
Testing with 10000 partitions
latency average = 296.878 ms
latency average = 293.927 ms
latency average = 294.654 ms
Testing with 1000 partitions
latency average = 292.680 ms
latency average = 283.245 ms
latency average = 280.857 ms
Testing with 100 partitions
latency average = 292.569 ms
latency average = 296.330 ms
latency average = 295.389 ms
Testing with 10 partitions
latency average = 285.909 ms
latency average = 287.499 ms
latency average = 293.322 ms
Testing with 1 partitions
latency average = 305.080 ms
latency average = 309.100 ms
latency average = 307.794 ms

There's noticeable change across all the number of partitions with
just "unlikely" change. The improvement is lesser with larger number
of partitions but quite visible with lesser number of partitions.

full patch
Testing with 1000000 partitions
latency average = 356.026 ms
latency average = 375.280 ms
latency average = 374.575 ms
Testing with 100000 partitions
latency average = 318.173 ms
latency average = 307.598 ms
latency average = 315.868 ms
Testing with 10000 partitions
latency average = 295.541 ms
latency average = 313.317 ms
latency average = 299.936 ms
Testing with 1000 partitions
latency average = 295.082 ms
latency average = 305.204 ms
latency average = 294.702 ms
Testing with 100 partitions
latency average = 302.552 ms
latency average = 307.596 ms
latency average = 304.202 ms
Testing with 10 partitions
latency average = 295.050 ms
latency average = 291.127 ms
latency average = 299.704 ms
Testing with 1 partitions
latency average = 308.781 ms
latency average = 304.071 ms
latency average = 319.560 ms

There is significant improvement with a large number of partitions as
seen previously. But for a smaller number of partitions the
performance worsens, which needs some investigation.
--
Best Wishes,
Ashutosh Bapat
Ashutosh Bapat <ashutosh.bapat.oss@gmail.com> writes:

> On Fri, Jul 12, 2024 at 11:59 AM Ashutosh Bapat
> <ashutosh.bapat.oss@gmail.com> wrote:
>>
>>
> Out of curiosity, I measured the performance with just the "unlikely"
> change and with the full patch. Below are the results
> Testing with 1000000 partitions
...
> latency average = 333.538 ms
>
> with just unlikely change
> Testing with 1000000 partitions
..
> Testing with 1 partitions
>
> There's noticeable change across all the number of partitions with
> just "unlikely" change.

I'm curious about why a 'unlikey' change can cause noticeable change,
especially there is just one function call in the 'if-statement' (I am
thinking more instrucments in the if-statement body, more changes it can
cause).

+    if (unlikely(winstate->buffer == NULL))
+        prepare_tuplestore(winstate);


--
Best Regards
Andy Fan
On Thu, 18 Jul 2024 at 19:56, Andy Fan <zhihuifan1213@163.com> wrote:
> I'm curious about why a 'unlikey' change can cause noticeable change,
> especially there is just one function call in the 'if-statement' (I am
> thinking more instrucments in the if-statement body, more changes it can
> cause).
>
> +       if (unlikely(winstate->buffer == NULL))
> +               prepare_tuplestore(winstate);

This isn't the branch being discussed.  We've not talked about whether
the above one is useful or not. The branch we were discussing is the
"if (winstate->all_first)", of which has a large number of
instructions inside it.

However, for this one, my understanding of this particular case is,
it's a very predictable branch as, even if the first prediction gets
it wrong the first time, it's not going to be wrong for long as the
condition is false for all subsequent calls. So, from there, if you
assume that the instruction decoder is always going to fetch the
correct instructions according to the branch predictor's correct
prediction (the ones for branch not taken), then the only benefit
possible is that the next instructions to execute are the next
instructions in the code rather than instructions located far away,
possibly on another cacheline that needs to be loaded from RAM or
higher cache levels.  Adding the unlikely() should coax the compiler
into laying out the code so the branch's instructions at the end of
the function and that, in theory, should reduce the likelihood of
frontend stalls waiting for cachelines for further instructions to
arrive from RAM or higher cache levels. That's my theory, at least.  I
expected to see perf stat show me a lower "stalled-cycles-frontend"
with the v2 patch than v1, but didn't see that when I looked, so my
theory might be wrong.

For the case you're mentioning above, calling the function isn't very
many instructions, so the benefits are likely very small with a branch
this predictable.

David
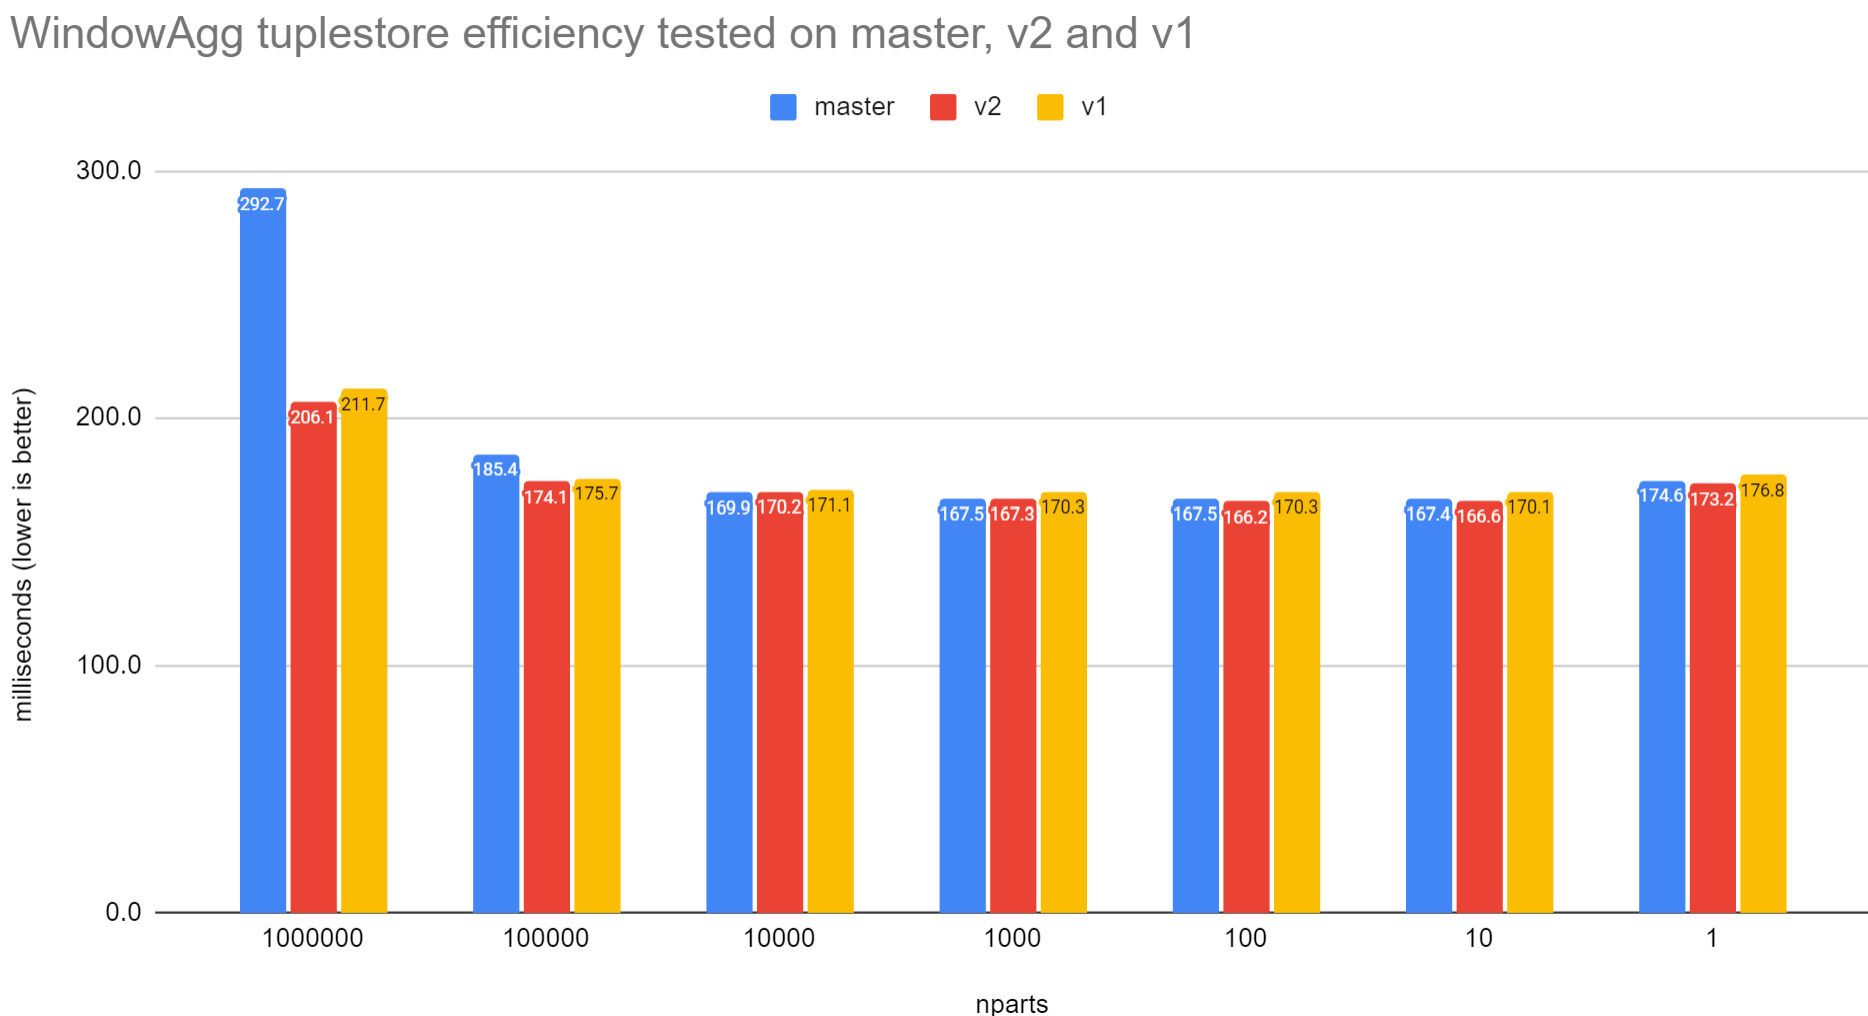
On Wed, Sep 4, 2024 at 8:20 PM David Rowley <dgrowleyml@gmail.com> wrote:
>
> On Mon, 19 Aug 2024 at 22:01, David Rowley <dgrowleyml@gmail.com> wrote:
> > To try and move this forward again, I adjusted the patch to use a
> > static function with pg_noinline rather than unlikely.  I don't think
> > this will make much difference code generation wise, but I did think
> > it was an improvement in code cleanliness. Patches attached.
> >
> > I did a round of benchmarking on an AMD Zen4 7945hx and on an Apple
> > M2. I also graphed the results you sent so they're easier to compare
> > with mine.
> >
> > 0001 is effectively the unlikely() patch for calculating the frame offsets.
> > 0002 is the tuplestore_reset() patch
>
> I was experimenting with this again.  The 0002 patch added a
> next_partition field to the WindowAggState struct and caused the
> struct to become slightly bigger.  I've now included a 0003 patch
> which shifts some fields around in that struct so as to keep it the
> same size as it is on master. Benchmarking with that removes that very
> tiny performance regression.

If patches are applied in the same sequence as yours, the size of
WindowAggState struct goes from 632 to 640 and then back to 632 on my
laptop. That looks a tiny but nice improvement by itself.

If the patches are applied in the order 0001, 0003 and 0002, the size
of the structure remains 632 throughout. Patch 0003 does not affect
the size of the structure by itself.

> I also
> tested this on an AMD 3990x machine along with fresh results from the
> AMD 7945hx laptop. Both of those machines come out faster on all tests
> when comparing master to all 3 patches.  With the Apple M2, there does
> not seem to be much change in performance with the tests containing
> fewer rows per partition, some are faster, some are slower, all within
> typical noise fluctuations.

I have similar observations as yours on my amd64 laptop. I also
verified that 0003 by itself is not effective. This indicates that the
(atleast some of the) regression caused by 0002 comes from larger
structure. Why would that happen?

>
> Given the performance now seems improved in all cases, I plan on
> pushing this change as a single commit.
>

Agreed. I will review the code in detail by next week.

--
Best Wishes,
Ashutosh Bapat
On Fri, 6 Sept 2024 at 18:30, Ashutosh Bapat
<ashutosh.bapat.oss@gmail.com> wrote:
> If the patches are applied in the order 0001, 0003 and 0002, the size
> of the structure remains 632 throughout. Patch 0003 does not affect
> the size of the structure by itself.

Yeah. I kept 0003 separate so it could be easily tested independently.

> I have similar observations as yours on my amd64 laptop. I also
> verified that 0003 by itself is not effective. This indicates that the
> (atleast some of the) regression caused by 0002 comes from larger
> structure. Why would that happen?

I don't know the exact reason, but it could be something as simple as
having to load an additional cacheline that we previously didn't need
to load. Or, perhaps more cachelines are being modified and that slows
down some cache eviction code.  The PostgreSQL executor isn't very
friendly to CPU caches as we do tuple-at-a-time execution and
continually switch to other nodes. That requires accessing executor
states only briefly before switching to another node to bubble tuples
to the top of the plan.

> > Given the performance now seems improved in all cases, I plan on
> > pushing this change as a single commit.
> >
>
> Agreed. I will review the code in detail by next week.

Thanks, but I've already pushed these patches. I ended up pushing
v4-0001 as a separate commit. v4-0002 and v4-0003 went in as one. Feel
free to still have a look though.

David