Thread: Postgres 17.4 is much slower than Postgres 15.12 using RECURSIVE
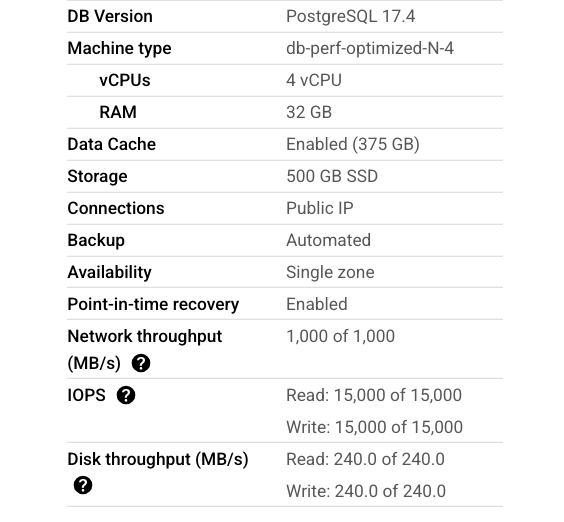
Postgres 17 version: PostgreSQL 17.4 on x86_64-pc-linux-gnu, compiled by Debian clang version 12.0.1, 64-bit
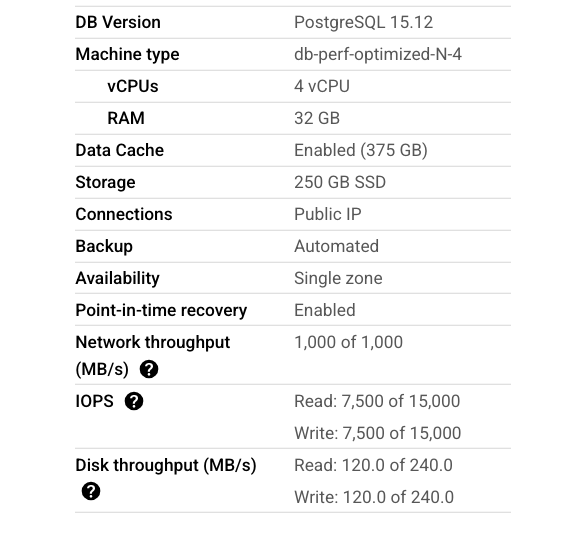
Postgres 15 version: PostgreSQL 15.12 on x86_64-pc-linux-gnu, compiled by Debian clang version 12.0.1, 64-bit
Description of Bug:
Using RECURSIVE in Postgres 17 is much slower than Postgres 15
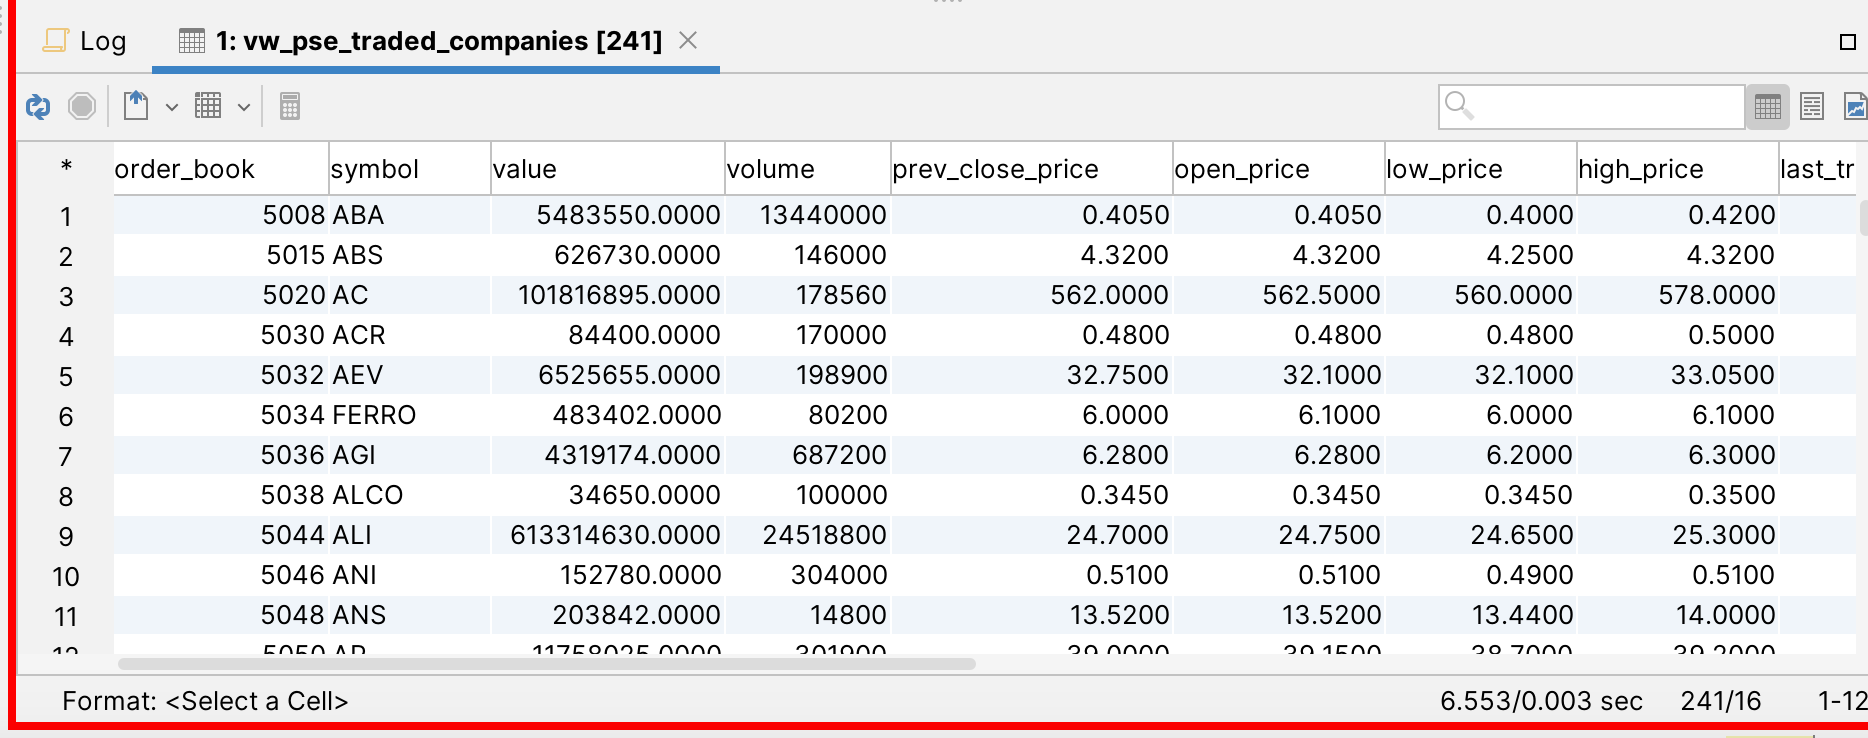
Postgres 17.4 : 6.533 seconds
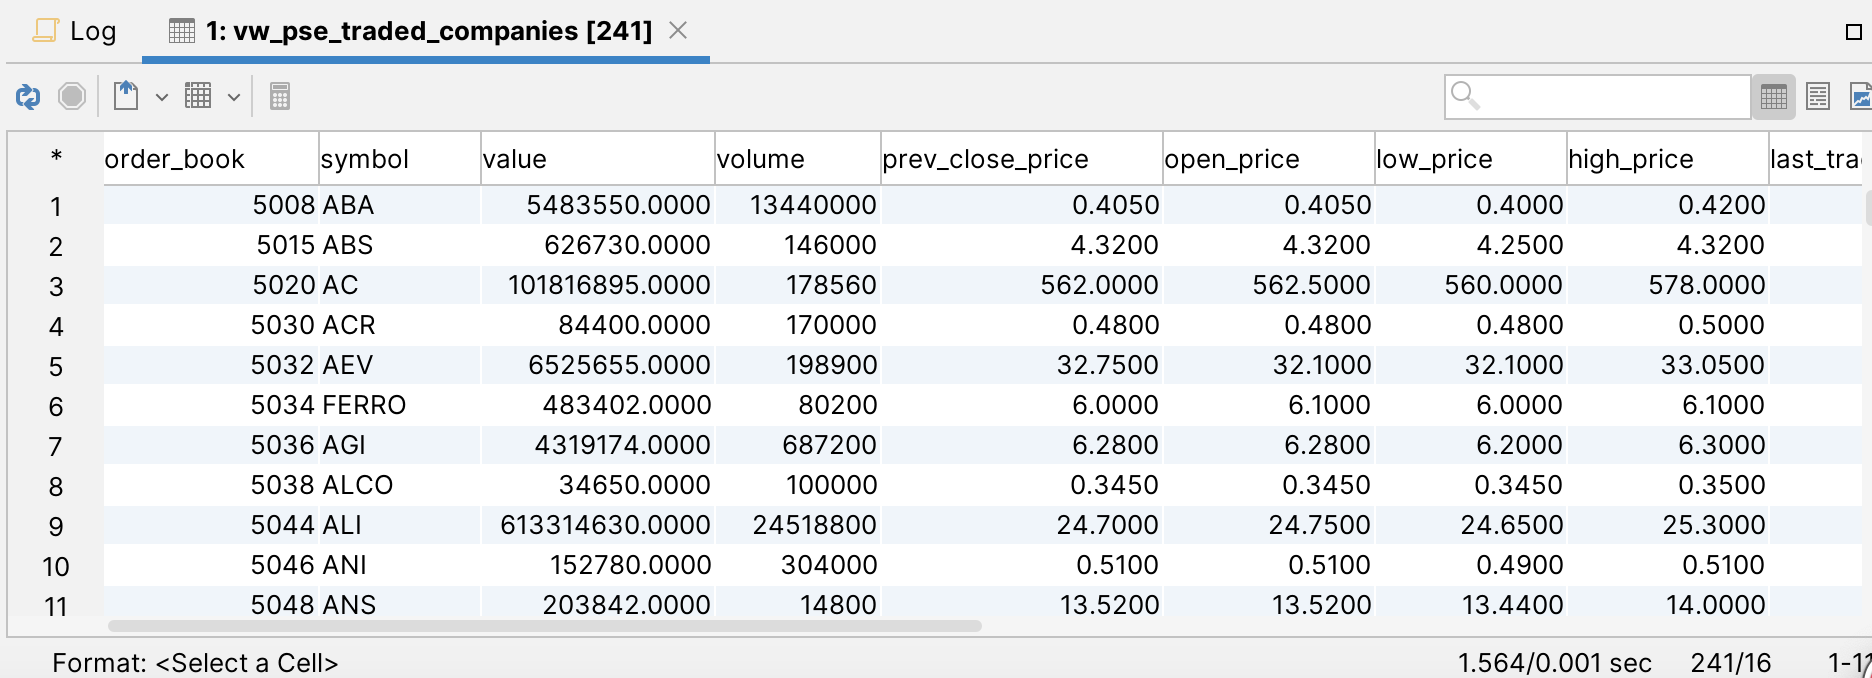
Postgres 15.12: 1.564 seconds
Same table objects, same tables indexes, same number of records
I ran vacuum, analyze, reindex, and cache (pg_warm) on both Postgres 17 and 15.
Note: I also used LATERAL, postgres 15 performance is superior than postgres17. Postgres15 timings is 2.3 compared to Postgres17 timings is avg 7 seconds.
SQL:
WITH RECURSIVE stock AS
(
SELECT prod.order_book,
prod.symbol,
value::numeric(20,4),
volume::numeric,
prev_close_price::numeric(20,4),
open_price::numeric(20,4),
low_price::numeric(20,4),
high_price::numeric(20,4),
last_trade_price::numeric(20,4),
avg_price::numeric(20,4),
close_price::numeric(20,4),
bestbidprice::numeric(20,4),
bestbidsize::numeric(20,0),
bestofferprice::numeric(20,4),
bestoffersize::numeric(20,0),
(((last_trade_price - prev_close_price)/prev_close_price)*100)::numeric(10,2) AS percentage
FROM vw_pse_traded_companies prod,
iq_get_stats_security_v1_4_4(prod.order_book,(
( SELECT
DATE(d.added_date) AS DATE
FROM
prod_itchbbo_s_small_message d
ORDER BY
d.added_date DESC
LIMIT
1))::TIMESTAMP without TIME zone)
WHERE
prod.group_name = 'N'
)
select * from stock where value is NOT NULL;Server Info: Postgres 17Server Info: Postgres 15Query Performance:Postgres 17:QUERY PLANCTE Scan on stock (cost=35697.80..43197.80 rows=373125 width=812) (actual time=28.778..6526.084 rows=241 loops=1)Filter: (value IS NOT NULL)Rows Removed by Filter: 138CTE stock-> Nested Loop (cost=68.11..35697.80 rows=375000 width=300) (actual time=4.819..6524.963 rows=379 loops=1)InitPlan 1-> Limit (cost=1.60..1.60 rows=1 width=12) (actual time=0.027..0.028 rows=1 loops=1)-> Sort (cost=1.60..1.68 rows=34 width=12) (actual time=0.027..0.028 rows=1 loops=1)Sort Key: d.added_date DESCSort Method: top-N heapsort Memory: 25kB-> Seq Scan on prod_itchbbo_s_small_message d (cost=0.00..1.43 rows=34 width=12) (actual time=0.004..0.008 rows=34 loops=1)-> Sort (cost=66.26..67.20 rows=375 width=4291) (actual time=0.442..0.666 rows=379 loops=1)Sort Key: info.order_book, listed.symbolSort Method: quicksort Memory: 42kB-> Hash Join (cost=18.62..50.23 rows=375 width=4291) (actual time=0.120..0.328 rows=379 loops=1)Hash Cond: ((info.symbol)::text = (listed.symbol)::text)-> Seq Scan on prod_stock_information info (cost=0.00..30.60 rows=380 width=12) (actual time=0.008..0.123 rows=380 loops=1)Filter: ((group_name)::text = 'N'::text)Rows Removed by Filter: 388-> Hash (cost=13.83..13.83 rows=383 width=4) (actual time=0.082..0.082 rows=383 loops=1)Buckets: 1024 Batches: 1 Memory Usage: 22kB-> Seq Scan on prod_pse_listed_companies listed (cost=0.00..13.83 rows=383 width=4) (actual time=0.003..0.038 rows=383 loops=1)-> Function Scan on iq_get_stats_security_v1_4_4 (cost=0.25..10.25 rows=1000 width=104) (actual time=17.197..17.197 rows=1 loops=379)Planning Time: 0.999 msExecution Time: 6526.908 msPostgres 15:QUERY PLANCTE Scan on stock (cost=35697.80..43197.80 rows=373125 width=812) (actual time=7.746..1443.691 rows=241 loops=1)Filter: (value IS NOT NULL)Rows Removed by Filter: 138CTE stock-> Nested Loop (cost=68.11..35697.80 rows=375000 width=300) (actual time=2.426..1443.143 rows=379 loops=1)InitPlan 1 (returns $0)-> Limit (cost=1.60..1.60 rows=1 width=12) (actual time=0.015..0.016 rows=1 loops=1)-> Sort (cost=1.60..1.68 rows=34 width=12) (actual time=0.014..0.014 rows=1 loops=1)Sort Key: d.added_date DESCSort Method: top-N heapsort Memory: 25kB-> Seq Scan on prod_itchbbo_s_small_message d (cost=0.00..1.43 rows=34 width=12) (actual time=0.005..0.008 rows=34 loops=1)-> Sort (cost=66.26..67.20 rows=375 width=4291) (actual time=0.466..0.563 rows=379 loops=1)Sort Key: info.order_book, listed.symbolSort Method: quicksort Memory: 51kB-> Hash Join (cost=18.62..50.23 rows=375 width=4291) (actual time=0.131..0.357 rows=379 loops=1)Hash Cond: ((info.symbol)::text = (listed.symbol)::text)-> Seq Scan on prod_stock_information info (cost=0.00..30.60 rows=380 width=12) (actual time=0.009..0.146 rows=380 loops=1)Filter: ((group_name)::text = 'N'::text)Rows Removed by Filter: 388-> Hash (cost=13.83..13.83 rows=383 width=4) (actual time=0.106..0.107 rows=383 loops=1)Buckets: 1024 Batches: 1 Memory Usage: 22kB-> Seq Scan on prod_pse_listed_companies listed (cost=0.00..13.83 rows=383 width=4) (actual time=0.005..0.061 rows=383 loops=1)-> Function Scan on iq_get_stats_security_v1_4_4 (cost=0.25..10.25 rows=1000 width=104) (actual time=3.797..3.797 rows=1 loops=379)Planning Time: 0.428 msExecution Time: 1443.823 ms


Attachment
Hi
po 28. 4. 2025 v 7:37 odesílatel marcos sicat <marcos.sicat@atlasifs.com> napsal:
Postgres 17 version: PostgreSQL 17.4 on x86_64-pc-linux-gnu, compiled by Debian clang version 12.0.1, 64-bitPostgres 15 version: PostgreSQL 15.12 on x86_64-pc-linux-gnu, compiled by Debian clang version 12.0.1, 64-bitDescription of Bug:Using RECURSIVE in Postgres 17 is much slower than Postgres 15Postgres 17.4 : 6.533 secondsPostgres 15.12: 1.564 secondsSame table objects, same tables indexes, same number of recordsI ran vacuum, analyze, reindex, and cache (pg_warm) on both Postgres 17 and 15.Note: I also used LATERAL, postgres 15 performance is superior than postgres17. Postgres15 timings is 2.3 compared to Postgres17 timings is avg 7 seconds.SQL:WITH RECURSIVE stock AS
(
SELECT prod.order_book,
prod.symbol,
value::numeric(20,4),
volume::numeric,
prev_close_price::numeric(20,4),
open_price::numeric(20,4),
low_price::numeric(20,4),
high_price::numeric(20,4),
last_trade_price::numeric(20,4),
avg_price::numeric(20,4),
close_price::numeric(20,4),
bestbidprice::numeric(20,4),
bestbidsize::numeric(20,0),
bestofferprice::numeric(20,4),
bestoffersize::numeric(20,0),
(((last_trade_price - prev_close_price)/prev_close_price)*100)::numeric(10,2) AS percentage
FROM vw_pse_traded_companies prod,
iq_get_stats_security_v1_4_4(prod.order_book,(
( SELECT
DATE(d.added_date) AS DATE
FROM
prod_itchbbo_s_small_message d
ORDER BY
d.added_date DESC
LIMIT
1))::TIMESTAMP without TIME zone)
WHERE
prod.group_name = 'N'
)
select * from stock where value is NOT NULL;Server Info: Postgres 17Server Info: Postgres 15Query Performance:Postgres 17:QUERY PLANCTE Scan on stock (cost=35697.80..43197.80 rows=373125 width=812) (actual time=28.778..6526.084 rows=241 loops=1)Filter: (value IS NOT NULL)Rows Removed by Filter: 138CTE stock-> Nested Loop (cost=68.11..35697.80 rows=375000 width=300) (actual time=4.819..6524.963 rows=379 loops=1)InitPlan 1-> Limit (cost=1.60..1.60 rows=1 width=12) (actual time=0.027..0.028 rows=1 loops=1)-> Sort (cost=1.60..1.68 rows=34 width=12) (actual time=0.027..0.028 rows=1 loops=1)Sort Key: d.added_date DESCSort Method: top-N heapsort Memory: 25kB-> Seq Scan on prod_itchbbo_s_small_message d (cost=0.00..1.43 rows=34 width=12) (actual time=0.004..0.008 rows=34 loops=1)-> Sort (cost=66.26..67.20 rows=375 width=4291) (actual time=0.442..0.666 rows=379 loops=1)Sort Key: info.order_book, listed.symbolSort Method: quicksort Memory: 42kB-> Hash Join (cost=18.62..50.23 rows=375 width=4291) (actual time=0.120..0.328 rows=379 loops=1)Hash Cond: ((info.symbol)::text = (listed.symbol)::text)-> Seq Scan on prod_stock_information info (cost=0.00..30.60 rows=380 width=12) (actual time=0.008..0.123 rows=380 loops=1)Filter: ((group_name)::text = 'N'::text)Rows Removed by Filter: 388-> Hash (cost=13.83..13.83 rows=383 width=4) (actual time=0.082..0.082 rows=383 loops=1)Buckets: 1024 Batches: 1 Memory Usage: 22kB-> Seq Scan on prod_pse_listed_companies listed (cost=0.00..13.83 rows=383 width=4) (actual time=0.003..0.038 rows=383 loops=1)-> Function Scan on iq_get_stats_security_v1_4_4 (cost=0.25..10.25 rows=1000 width=104) (actual time=17.197..17.197 rows=1 loops=379)Planning Time: 0.999 msExecution Time: 6526.908 msPostgres 15:QUERY PLANCTE Scan on stock (cost=35697.80..43197.80 rows=373125 width=812) (actual time=7.746..1443.691 rows=241 loops=1)Filter: (value IS NOT NULL)Rows Removed by Filter: 138CTE stock-> Nested Loop (cost=68.11..35697.80 rows=375000 width=300) (actual time=2.426..1443.143 rows=379 loops=1)InitPlan 1 (returns $0)-> Limit (cost=1.60..1.60 rows=1 width=12) (actual time=0.015..0.016 rows=1 loops=1)-> Sort (cost=1.60..1.68 rows=34 width=12) (actual time=0.014..0.014 rows=1 loops=1)Sort Key: d.added_date DESCSort Method: top-N heapsort Memory: 25kB-> Seq Scan on prod_itchbbo_s_small_message d (cost=0.00..1.43 rows=34 width=12) (actual time=0.005..0.008 rows=34 loops=1)-> Sort (cost=66.26..67.20 rows=375 width=4291) (actual time=0.466..0.563 rows=379 loops=1)Sort Key: info.order_book, listed.symbolSort Method: quicksort Memory: 51kB-> Hash Join (cost=18.62..50.23 rows=375 width=4291) (actual time=0.131..0.357 rows=379 loops=1)Hash Cond: ((info.symbol)::text = (listed.symbol)::text)-> Seq Scan on prod_stock_information info (cost=0.00..30.60 rows=380 width=12) (actual time=0.009..0.146 rows=380 loops=1)Filter: ((group_name)::text = 'N'::text)Rows Removed by Filter: 388-> Hash (cost=13.83..13.83 rows=383 width=4) (actual time=0.106..0.107 rows=383 loops=1)Buckets: 1024 Batches: 1 Memory Usage: 22kB-> Seq Scan on prod_pse_listed_companies listed (cost=0.00..13.83 rows=383 width=4) (actual time=0.005..0.061 rows=383 loops=1)-> Function Scan on iq_get_stats_security_v1_4_4 (cost=0.25..10.25 rows=1000 width=104) (actual time=3.797..3.797 rows=1 loops=379)Planning Time: 0.428 msExecution Time: 1443.823 ms


The plan is same, but the execution of
iq_get_stats_security_v1_4_4
is 4x slower - 17ms x 4 ms, so you should to check iq_get_stats_security_v1_4_4
Regards
Pavel
Attachment
Thanks, Pavel.
The function is the same between v15 and v17. Is there a subtle difference in performance for nested subqueries in v17?
--/
CREATE FUNCTION iq_get_stats_security_v1_4_4 (bigint, timestamp without time zone)  RETURNS TABLE(value double precision, volume double precision, avg_price double precision, high_price double precision, low_price double precision, stock_date timestamp without time zone, bestbidprice double precision, bestbidsize double precision, bestofferprice double precision, bestoffersize double precision, last_trade_price double precision, close_price double precision, open_price double precision, prev_close_price double precision, outstanding_shares bigint)
  VOLATILE
AS $body$
BEGIN
RETURN query

SELECT Cast(Round(Sum(STATS."value"), 4) AS double precision) AS "value",
Cast(Sum(STATS."volume") AS double precision) AS "volume",
Cast(Round(Sum(STATS."value"), 4) AS double precision)/Cast(Sum(STATS."volume") AS double precision) AS "avg_price",
Cast(Round(MAX(STATS."high_price"), 4) AS double precision) AS "high_price",
Cast(Round(MIN(STATS."low_price"), 4) AS double precision) AS "low_price",
MAX(STATS."stock_date") AS "stock_date",
Cast(MAX(BBO."bestbidprice") AS double precision),
Cast(MAX(BBO."bestbidsize") AS double precision),
Cast(MAX(BBO."bestofferprice") AS double precision),
Cast(MAX(BBO."bestoffersize") AS double precision),
Cast(MAX(LTP."trade_price") AS double precision),
Cast(MAX(CLOSEP."close_price")AS double precision),
Cast(MAX(OPENING."trade_price")AS double precision),
Cast(MAX(PREVCLOSEP."prev_close_price")AS double precision),
Cast(MAX(STOCKINFO."outstanding_shares") AS bigint) as "outstanding_shares"

FROM   (

    SELECT Sum(TRADES.executed_quantity * Cast(TRADES.execution_price AS DECIMAL) / 10000) AS "value",
           Sum(TRADES.executed_quantity)AS "volume",
           AVG(Cast(TRADES.execution_price AS DECIMAL) / 10000) AS "avg_price",
           MAX(Cast(TRADES.execution_price AS DECIMAL) / 10000) AS "high_price",
           MIN(Cast(TRADES.execution_price AS DECIMAL) / 10000) AS "low_price",
           MAX(TRADES.msg_date) AS "stock_date"
    FROM
    (
        SELECT distinct on (TRADES_P."trade_id") * from(

            SELECT p.msg_date,p.executed_quantity,p.execution_price,
                       (p.match_number) AS "trade_id"
                FROM PUBLIC.prod_itchbbo_p_small_message p
                WHERE Date(p.msg_date) = $2
                  AND p.printable = 'Y'
                  AND p.order_book=$1
                ORDER BY p.match_number DESC

        ) AS TRADES_P Order by "trade_id" ASC
    )AS TRADES


) AS STATS
,
( Select Cast(best_bid_price AS double precision) / 10000 AS "bestbidprice",
         Cast(best_bid_size AS double precision) AS "bestbidsize" ,
         Cast(best_offer_price AS double precision) / 10000  AS "bestofferprice",
         Cast(best_offer_size AS double precision) AS "bestoffersize"
  FROM public.prod_itchbbo_o_message
  WHERE order_book = $1
  AND date(added_date)= $2

    AND added_date::timestamp::time<=
    (
        SELECT   s.msg_date::timestamp::time
        FROM     prod_itch_s_message s
        WHERE    s.event_code='M'
        ORDER BY s.msg_date DESC limit 1
    )
  ORDER BY msg_date desc limit 1
            ) as BBO
,( select LASTTRADE.trade_price from

(
        SELECT * from(SELECT (Cast(execution_price AS double precision) / 10000) AS "trade_price",
                       (match_number) AS "trade_id"
                FROM PUBLIC.prod_itchbbo_p_small_message
                WHERE order_book = $1
                  AND Date(added_date) = $2
                  AND printable = 'Y'
                ORDER BY match_number DESC limit 1) AS TRADES_P


) AS LASTTRADE order by LASTTRADE.trade_id DESC limit 1 ) as LTP

,( select max(Cast(closePrice."close_price" AS double precision) )as "close_price" from(Select Cast(execution_price AS double precision) / 10000 as "close_price" from PUBLIC.prod_itchbbo_p_small_message
    where date(msg_date)=$2
    and executed_quantity = 0
    and order_book =$1  order by msg_date DESC limit 1 )as closePrice)as CLOSEP


,( select FIRSTTRADE.trade_price from

(

        SELECT * from(SELECT (Cast(execution_price AS double precision) / 10000) AS "trade_price",
                       (match_number) AS "trade_id"
                FROM PUBLIC.prod_itchbbo_p_small_message
                WHERE order_book = $1
                  AND Date(added_date) = $2
                  AND printable = 'Y'
                ORDER BY match_number asc limit 1) AS TRADES_P


) AS FIRSTTRADE order by FIRSTTRADE.trade_id ASC limit 1

) as OPENING

,( Select Cast(price AS double precision) / 10000 as "prev_close_price" from public.prod_itch_a_message
    where date(msg_date)=$2
    and order_number = 0
    and orderbook =$1 order by msg_date ASC limit 1 )as PREVCLOSEP

,( Select Cast(shares AS bigint) as "outstanding_shares" from public.prod_stock_information
        where order_book = $1 and group_name = 'N' ) as STOCKINFO

;

END;
$body$ LANGUAGE plpgsql
/
From: Pavel Stehule <pavel.stehule@gmail.com>
Date: Monday, April 28, 2025 at 2:17 AM
To: marcos sicat <marcos.sicat@atlasifs.com>
Cc: pgsql-bugs@lists.postgresql.org <pgsql-bugs@lists.postgresql.org>
Subject: Re: Postgres 17.4 is much slower than Postgres 15.12 using RECURSIVE
Date: Monday, April 28, 2025 at 2:17 AM
To: marcos sicat <marcos.sicat@atlasifs.com>
Cc: pgsql-bugs@lists.postgresql.org <pgsql-bugs@lists.postgresql.org>
Subject: Re: Postgres 17.4 is much slower than Postgres 15.12 using RECURSIVE
Hi
po 28. 4. 2025 v 7:37 odesílatel marcos sicat <marcos.sicat@atlasifs.com> napsal:
Postgres 17 version: PostgreSQL 17.4 on x86_64-pc-linux-gnu, compiled by Debian clang version 12.0.1, 64-bitPostgres 15 version: PostgreSQL 15.12 on x86_64-pc-linux-gnu, compiled by Debian clang version 12.0.1, 64-bitDescription of Bug:Using RECURSIVE in Postgres 17 is much slower than Postgres 15Postgres 17.4 : 6.533 secondsPostgres 15.12: 1.564 secondsSame table objects, same tables indexes, same number of recordsI ran vacuum, analyze, reindex, and cache (pg_warm) on both Postgres 17 and 15.Note: I also used LATERAL, postgres 15 performance is superior than postgres17. Postgres15 timings is 2.3 compared to Postgres17 timings is avg 7 seconds.SQL:WITH RECURSIVE stock AS
(
SELECT prod.order_book,
prod.symbol,
value::numeric(20,4),
volume::numeric,
prev_close_price::numeric(20,4),
open_price::numeric(20,4),
low_price::numeric(20,4),
high_price::numeric(20,4),
last_trade_price::numeric(20,4),
avg_price::numeric(20,4),
close_price::numeric(20,4),
bestbidprice::numeric(20,4),
bestbidsize::numeric(20,0),
bestofferprice::numeric(20,4),
bestoffersize::numeric(20,0),
(((last_trade_price - prev_close_price)/prev_close_price)*100)::numeric(10,2) AS percentage
FROM vw_pse_traded_companies prod,
iq_get_stats_security_v1_4_4(prod.order_book,(
( SELECT
DATE(d.added_date) AS DATE
FROM
prod_itchbbo_s_small_message d
ORDER BY
d.added_date DESC
LIMIT
1))::TIMESTAMP without TIME zone)
WHERE
prod.group_name = 'N'
)
select * from stock where value is NOT NULL;Server Info: Postgres 17Server Info: Postgres 15Query Performance:Postgres 17:QUERY PLANCTE Scan on stock (cost=35697.80..43197.80 rows=373125 width=812) (actual time=28.778..6526.084 rows=241 loops=1)Filter: (value IS NOT NULL)Rows Removed by Filter: 138CTE stock-> Nested Loop (cost=68.11..35697.80 rows=375000 width=300) (actual time=4.819..6524.963 rows=379 loops=1)InitPlan 1-> Limit (cost=1.60..1.60 rows=1 width=12) (actual time=0.027..0.028 rows=1 loops=1)-> Sort (cost=1.60..1.68 rows=34 width=12) (actual time=0.027..0.028 rows=1 loops=1)Sort Key: d.added_date DESCSort Method: top-N heapsort Memory: 25kB-> Seq Scan on prod_itchbbo_s_small_message d (cost=0.00..1.43 rows=34 width=12) (actual time=0.004..0.008 rows=34 loops=1)-> Sort (cost=66.26..67.20 rows=375 width=4291) (actual time=0.442..0.666 rows=379 loops=1)Sort Key: info.order_book, listed.symbolSort Method: quicksort Memory: 42kB-> Hash Join (cost=18.62..50.23 rows=375 width=4291) (actual time=0.120..0.328 rows=379 loops=1)Hash Cond: ((info.symbol)::text = (listed.symbol)::text)-> Seq Scan on prod_stock_information info (cost=0.00..30.60 rows=380 width=12) (actual time=0.008..0.123 rows=380 loops=1)Filter: ((group_name)::text = 'N'::text)Rows Removed by Filter: 388-> Hash (cost=13.83..13.83 rows=383 width=4) (actual time=0.082..0.082 rows=383 loops=1)Buckets: 1024 Batches: 1 Memory Usage: 22kB-> Seq Scan on prod_pse_listed_companies listed (cost=0.00..13.83 rows=383 width=4) (actual time=0.003..0.038 rows=383 loops=1)-> Function Scan on iq_get_stats_security_v1_4_4 (cost=0.25..10.25 rows=1000 width=104) (actual time=17.197..17.197 rows=1 loops=379)Planning Time: 0.999 msExecution Time: 6526.908 msPostgres 15:QUERY PLANCTE Scan on stock (cost=35697.80..43197.80 rows=373125 width=812) (actual time=7.746..1443.691 rows=241 loops=1)Filter: (value IS NOT NULL)Rows Removed by Filter: 138CTE stock-> Nested Loop (cost=68.11..35697.80 rows=375000 width=300) (actual time=2.426..1443.143 rows=379 loops=1)InitPlan 1 (returns $0)-> Limit (cost=1.60..1.60 rows=1 width=12) (actual time=0.015..0.016 rows=1 loops=1)-> Sort (cost=1.60..1.68 rows=34 width=12) (actual time=0.014..0.014 rows=1 loops=1)Sort Key: d.added_date DESCSort Method: top-N heapsort Memory: 25kB-> Seq Scan on prod_itchbbo_s_small_message d (cost=0.00..1.43 rows=34 width=12) (actual time=0.005..0.008 rows=34 loops=1)-> Sort (cost=66.26..67.20 rows=375 width=4291) (actual time=0.466..0.563 rows=379 loops=1)Sort Key: info.order_book, listed.symbolSort Method: quicksort Memory: 51kB-> Hash Join (cost=18.62..50.23 rows=375 width=4291) (actual time=0.131..0.357 rows=379 loops=1)Hash Cond: ((info.symbol)::text = (listed.symbol)::text)-> Seq Scan on prod_stock_information info (cost=0.00..30.60 rows=380 width=12) (actual time=0.009..0.146 rows=380 loops=1)Filter: ((group_name)::text = 'N'::text)Rows Removed by Filter: 388-> Hash (cost=13.83..13.83 rows=383 width=4) (actual time=0.106..0.107 rows=383 loops=1)Buckets: 1024 Batches: 1 Memory Usage: 22kB-> Seq Scan on prod_pse_listed_companies listed (cost=0.00..13.83 rows=383 width=4) (actual time=0.005..0.061 rows=383 loops=1)-> Function Scan on iq_get_stats_security_v1_4_4 (cost=0.25..10.25 rows=1000 width=104) (actual time=3.797..3.797 rows=1 loops=379)Planning Time: 0.428 msExecution Time: 1443.823 ms


The plan is same, but the execution of
iq_get_stats_security_v1_4_4
is 4x slower - 17ms x 4 ms, so you should to check iq_get_stats_security_v1_4_4
Regards
Pavel
Attachment
marcos sicat <marcos.sicat@atlasifs.com> writes:
> The function is the same between v15 and v17.  Is there a subtle difference in performance for nested subqueries in
v17?

Your next step should be to compare the plans for the function's
query.  The auto_explain or pg_stat_statements extensions could
be used to check that in-situ, if manually EXPLAINing that query
doesn't yield insight.

            regards, tom lane
Thanks, Tom.
After you made your recommendation, the result returned much quicker at 2.62 seconds, but v15 is still faster at 1.82 seconds. No modification was made to the function.

From: Tom Lane <tgl@sss.pgh.pa.us>
Date: Monday, April 28, 2025 at 9:59 AM
To: marcos sicat <marcos.sicat@atlasifs.com>
Cc: Pavel Stehule <pavel.stehule@gmail.com>, pgsql-bugs@lists.postgresql.org <pgsql-bugs@lists.postgresql.org>
Subject: Re: Postgres 17.4 is much slower than Postgres 15.12 using RECURSIVE
Date: Monday, April 28, 2025 at 9:59 AM
To: marcos sicat <marcos.sicat@atlasifs.com>
Cc: Pavel Stehule <pavel.stehule@gmail.com>, pgsql-bugs@lists.postgresql.org <pgsql-bugs@lists.postgresql.org>
Subject: Re: Postgres 17.4 is much slower than Postgres 15.12 using RECURSIVE
marcos sicat <marcos.sicat@atlasifs.com> writes:
> The function is the same between v15 and v17. Is there a subtle difference in performance for nested subqueries in v17?
Your next step should be to compare the plans for the function's
query. The auto_explain or pg_stat_statements extensions could
be used to check that in-situ, if manually EXPLAINing that query
doesn't yield insight.
regards, tom lane
Attachment
Hi
po 28. 4. 2025 v 23:53 odesílatel marcos sicat <marcos.sicat@atlasifs.com> napsal:
Thanks, Tom.After you made your recommendation, the result returned much quicker at 2.62 seconds, but v15 is still faster at 1.82 seconds. No modification was made to the function.
and you look at the log file and separate query plans from there.
proposed changes just force storing query plans to the log file.
From plans we can see what is different
Regards
Pavel
From: Tom Lane <tgl@sss.pgh.pa.us>
Date: Monday, April 28, 2025 at 9:59 AM
To: marcos sicat <marcos.sicat@atlasifs.com>
Cc: Pavel Stehule <pavel.stehule@gmail.com>, pgsql-bugs@lists.postgresql.org <pgsql-bugs@lists.postgresql.org>
Subject: Re: Postgres 17.4 is much slower than Postgres 15.12 using RECURSIVEmarcos sicat <marcos.sicat@atlasifs.com> writes:
> The function is the same between v15 and v17. Is there a subtle difference in performance for nested subqueries in v17?
Your next step should be to compare the plans for the function's
query. The auto_explain or pg_stat_statements extensions could
be used to check that in-situ, if manually EXPLAINing that query
doesn't yield insight.
regards, tom lane
Attachment
I was able to capture the Qplans for both, and I highlighted the differences in red. Are there server settings differences between v17 and v15 by default?
What would be the suggested configuration settings in v17 that would behave like v15 and match the performance with v15?
From: Pavel Stehule <pavel.stehule@gmail.com>
Date: Tuesday, April 29, 2025 at 1:01 AM
To: marcos sicat <marcos.sicat@atlasifs.com>
Cc: Tom Lane <tgl@sss.pgh.pa.us>, pgsql-bugs@lists.postgresql.org <pgsql-bugs@lists.postgresql.org>
Subject: Re: Postgres 17.4 is much slower than Postgres 15.12 using RECURSIVE
Date: Tuesday, April 29, 2025 at 1:01 AM
To: marcos sicat <marcos.sicat@atlasifs.com>
Cc: Tom Lane <tgl@sss.pgh.pa.us>, pgsql-bugs@lists.postgresql.org <pgsql-bugs@lists.postgresql.org>
Subject: Re: Postgres 17.4 is much slower than Postgres 15.12 using RECURSIVE
Hi
po 28. 4. 2025 v 23:53 odesílatel marcos sicat <marcos.sicat@atlasifs.com> napsal:
Thanks, Tom.After you made your recommendation, the result returned much quicker at 2.62 seconds, but v15 is still faster at 1.82 seconds. No modification was made to the function.
and you look at the log file and separate query plans from there.
proposed changes just force storing query plans to the log file.
From plans we can see what is different
Regards
Pavel
From: Tom Lane <tgl@sss.pgh.pa.us>
Date: Monday, April 28, 2025 at 9:59 AM
To: marcos sicat <marcos.sicat@atlasifs.com>
Cc: Pavel Stehule <pavel.stehule@gmail.com>, pgsql-bugs@lists.postgresql.org <pgsql-bugs@lists.postgresql.org>
Subject: Re: Postgres 17.4 is much slower than Postgres 15.12 using RECURSIVEmarcos sicat <marcos.sicat@atlasifs.com> writes:
> The function is the same between v15 and v17. Is there a subtle difference in performance for nested subqueries in v17?
Your next step should be to compare the plans for the function's
query. The auto_explain or pg_stat_statements extensions could
be used to check that in-situ, if manually EXPLAINing that query
doesn't yield insight.
regards, tom lane

Attachment
On Thu, 1 May 2025 at 09:43, marcos sicat <marcos.sicat@atlasifs.com> wrote:
> I was able to capture the Qplans for both, and I highlighted the differences in red. Are there server settings
differencesbetween v17 and v15 by default?

>
> What would be the suggested configuration settings in v17 that would behave like v15 and match the performance with
v15?

(I'd recommend in the future attaching two text files, one for each
plan. You might find people don't want to open spreadsheets received
through email.)

It looks like v17 doesn't want to use the indexgraph1D index on
prod_itchbbo_p_small_message. You should check if that index exists on
the v17 instance.  v17 does see the Seq Scan as the cheaper option.
I'm unsure why that would have changed between v15 and v17. Are
seq_page_cost, random_page_cost, and effective_cache_size all set to
the same as on v15?

You could do:

create index on prod_itchbbo_p_small_message (order_book, date(added_date));

and the planner would likely make use of the more selective index. The
"printable" might be worth adding as well, depending on how many rows
you still see in the "Rows Removed by Filter".

David
Thanks for the advice, David. I will check the settings and also the index. Some database technologies (I won’t mention here ) have an index advisor. Once turned on, it will suggest or recommend creating an index. I migrated to Postgres from Sybase and MS SQL in 2019. I am using Postgres for an online stock trading platform.
From: David Rowley <dgrowleyml@gmail.com>
Date: Wednesday, April 30, 2025 at 7:16 PM
To: marcos sicat <marcos.sicat@atlasifs.com>
Cc: Pavel Stehule <pavel.stehule@gmail.com>, Tom Lane <tgl@sss.pgh.pa.us>, pgsql-bugs@lists.postgresql.org <pgsql-bugs@lists.postgresql.org>
Subject: Re: Postgres 17.4 is much slower than Postgres 15.12 using RECURSIVE
On Thu, 1 May 2025 at 09:43, marcos sicat <marcos.sicat@atlasifs.com> wrote:
> I was able to capture the Qplans for both, and I highlighted the differences in red. Are there server settings differences between v17 and v15 by default?
>
> What would be the suggested configuration settings in v17 that would behave like v15 and match the performance with v15?
(I'd recommend in the future attaching two text files, one for each
plan. You might find people don't want to open spreadsheets received
through email.)
It looks like v17 doesn't want to use the indexgraph1D index on
prod_itchbbo_p_small_message. You should check if that index exists on
the v17 instance. v17 does see the Seq Scan as the cheaper option.
I'm unsure why that would have changed between v15 and v17. Are
seq_page_cost, random_page_cost, and effective_cache_size all set to
the same as on v15?
You could do:
create index on prod_itchbbo_p_small_message (order_book, date(added_date));
and the planner would likely make use of the more selective index. The
"printable" might be worth adding as well, depending on how many rows
you still see in the "Rows Removed by Filter".
David
Hi David,
After adding the suggested index, the optimizer picked up the index, and the query ran in 36ms in v15 and 33ms in v17.
Thank you!
QUERY PLAN
-> Bitmap Index Scan on orderbook_added_date_printable_idx (cost=0.00..120.46 rows=8324 width=0) (actual time=0.496..0.496 rows=8589 loops=1)
-> Bitmap Index Scan on orderbook_added_date_printable_idx (cost=0.00..120.46 rows=8324 width=0) (actual time=0.496..0.496 rows=8589 loops=1)
From: marcos sicat <marcos.sicat@atlasifs.com>
Date: Wednesday, April 30, 2025 at 7:53 PM
To: David Rowley <dgrowleyml@gmail.com>
Cc: Pavel Stehule <pavel.stehule@gmail.com>, Tom Lane <tgl@sss.pgh.pa.us>, pgsql-bugs@lists.postgresql.org <pgsql-bugs@lists.postgresql.org>
Subject: Re: Postgres 17.4 is much slower than Postgres 15.12 using RECURSIVE
Thanks for the advice, David. I will check the settings and also the index. Some database technologies (I won’t mention here ) have an index advisor. Once turned on, it will suggest or recommend creating an index. I migrated to Postgres from Sybase and MS SQL in 2019. I am using Postgres for an online stock trading platform.
From: David Rowley <dgrowleyml@gmail.com>
Date: Wednesday, April 30, 2025 at 7:16 PM
To: marcos sicat <marcos.sicat@atlasifs.com>
Cc: Pavel Stehule <pavel.stehule@gmail.com>, Tom Lane <tgl@sss.pgh.pa.us>, pgsql-bugs@lists.postgresql.org <pgsql-bugs@lists.postgresql.org>
Subject: Re: Postgres 17.4 is much slower than Postgres 15.12 using RECURSIVE
Date: Wednesday, April 30, 2025 at 7:16 PM
To: marcos sicat <marcos.sicat@atlasifs.com>
Cc: Pavel Stehule <pavel.stehule@gmail.com>, Tom Lane <tgl@sss.pgh.pa.us>, pgsql-bugs@lists.postgresql.org <pgsql-bugs@lists.postgresql.org>
Subject: Re: Postgres 17.4 is much slower than Postgres 15.12 using RECURSIVE
On Thu, 1 May 2025 at 09:43, marcos sicat <marcos.sicat@atlasifs.com> wrote:
> I was able to capture the Qplans for both, and I highlighted the differences in red. Are there server settings differences between v17 and v15 by default?
>
> What would be the suggested configuration settings in v17 that would behave like v15 and match the performance with v15?
(I'd recommend in the future attaching two text files, one for each
plan. You might find people don't want to open spreadsheets received
through email.)
It looks like v17 doesn't want to use the indexgraph1D index on
prod_itchbbo_p_small_message. You should check if that index exists on
the v17 instance. v17 does see the Seq Scan as the cheaper option.
I'm unsure why that would have changed between v15 and v17. Are
seq_page_cost, random_page_cost, and effective_cache_size all set to
the same as on v15?
You could do:
create index on prod_itchbbo_p_small_message (order_book, date(added_date));
and the planner would likely make use of the more selective index. The
"printable" might be worth adding as well, depending on how many rows
you still see in the "Rows Removed by Filter".
David
> I was able to capture the Qplans for both, and I highlighted the differences in red. Are there server settings differences between v17 and v15 by default?
>
> What would be the suggested configuration settings in v17 that would behave like v15 and match the performance with v15?
(I'd recommend in the future attaching two text files, one for each
plan. You might find people don't want to open spreadsheets received
through email.)
It looks like v17 doesn't want to use the indexgraph1D index on
prod_itchbbo_p_small_message. You should check if that index exists on
the v17 instance. v17 does see the Seq Scan as the cheaper option.
I'm unsure why that would have changed between v15 and v17. Are
seq_page_cost, random_page_cost, and effective_cache_size all set to
the same as on v15?
You could do:
create index on prod_itchbbo_p_small_message (order_book, date(added_date));
and the planner would likely make use of the more selective index. The
"printable" might be worth adding as well, depending on how many rows
you still see in the "Rows Removed by Filter".
David